


by Jose-Miguel Horcas (ITIS Software, Universidad de Málaga)
As the research community increasingly embraces Open Science, the need for transparent and accessible tools to understand academic productivity has become more pressing. BibTexViz [L1] bridges the gap between raw bibliographic data and insightful visual analytics, enabling researchers to explore their career trajectories while aligning with the principles of the CoARA and DORA initiatives.
The evaluation of research productivity is undergoing a paradigm shift. Traditional assessment practices, often based on proprietary publication databases and metrics that lack transparency, are increasingly being challenged by the global movement toward Open Science. Initiatives such as the San Francisco Declaration on Research Assessment (DORA) [L2] and the Coalition for Advancing Research Assessment (COARA) [L3] advocate for more transparent, diverse, and responsible approaches to evaluating research impact. In this evolving context, enabling researchers to own, explore, and communicate their own bibliographic data has become a central concern.
Despite the abundance of digital research information, many researchers find it difficult to maintain an up-to-date and meaningful overview of their scientific output. University research portals [L4, L5] aim to address this need, yet they often rely on proprietary databases, such as Scopus or Web of Science. These systems may exclude high-quality open-access venues or regional conferences and frequently require costly licensing agreements covered by public funds, raising concerns about reproducibility, inclusiveness, and sustainability.
BibTexViz: From BibTeX to Insight
BibTeX remains the de facto standard for managing bibliographic references in computer science and many other disciplines. Researchers routinely curate BibTeX files for papers and grant proposals, making them an ideal foundation for analysis and visualization. BibTexViz builds on this practice by transforming standard BibTeX entries into interactive and structured visualizations that provide immediate insight into a researcher’s publication history (Figure 1).
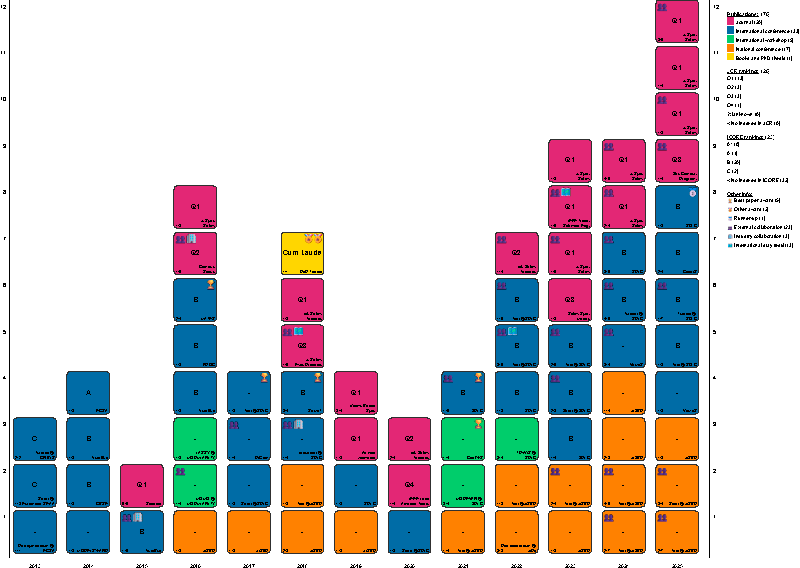
Figure 1: Interactive visualization of a researcher’s publication record generated by BibTexViz.
In BibTexViz, each publication is represented as a visual element positioned along a temporal axis and enriched with semantic information such as venue type, collaboration context, or special annotations. This design enables users to generate a comprehensive visual map of their academic trajectory, revealing patterns hidden in traditional text-based lists.
Technical Integration and Open Data
BibTexViz operates on two complementary input levels. First, it integrates directly with DBLP, the open computer science bibliography [L6]. DBLP provides high-quality, curated bibliographic data for major journals and conferences, and has long been a cornerstone of open bibliographic infrastructure. Today, it is operated and further developed by Schloss Dagstuhl [L7], ensuring long-term sustainability and openness. By entering a researcher’s DBLP identifier, BibTexViz automatically retrieves recent and verified bibliographic data, ensuring high data quality with minimal effort from the user.
Second, recognizing that no automated database is fully comprehensive, BibTexViz allows researchers to provide custom BibTeX files. This functionality enables the inclusion of publications not indexed in DBLP, interdisciplinary outputs, or domain-specific venues. Additionally, BibTexViz supports extended BibTeX fields, allowing users to add qualitative metadata such as tags for “Best Paper” awards, industrial collaborations, or international research stays. This customization is particularly valuable when preparing evaluation dossiers for tenure tracks, research productivity assessments, or grant applications, where contextual information complements quantitative indicators.
Visualization Design
BibTexViz follows established visualization best practices [2], emphasizing clarity, consistency, and cognitive efficiency. Visual encodings are intentionally simple, avoiding clutter while conveying rich information. Color, shape, and spatial grouping are used to distinguish publication types, venues, and collaboration patterns in a way that remains interpretable even for large publication records.
Figure 1 shows an example visualization generated by BibTexViz for an individual researcher. The visualization illustrates how publications are distributed over time, how different types of venue categories are visually separated, and how milestones such as awards or major achievements can be highlighted. Such visual summaries provide an immediate overview that complements traditional publication lists in terms of interpretability and communicative power.
Open Science
BibTexViz is deeply rooted in the principles of Open Science and responsible research assessment. Rather than computing scores, rankings, or impact factors, the tool empowers researchers to tell the story of their research using open data and transparent visual representations. This approach aligns directly with the recommendations of DORA and COARA, which emphasize the transition from quantitative-based metrics toward contextual and qualitative evaluation practices [2].
By relying on DBLP as a primary data source and remaining fully open source, BibTexViz promotes the use of non-proprietary research infrastructures. Both the data sources and the visualization logic are transparent and inspectable, enabling reuse, verification, and integration with other tools and workflows. This openness allows BibTexViz to evolve as part of a broader ecosystem of open scholarly infrastructures rather than as a standalone, closed platform.
Supporting Researchers in Practice
Beyond formal evaluation contexts, BibTexViz supports everyday research activities as a tool for reflection and strategic planning [3]. Researchers can use it to analyze their publication strategies, identify under-represented venues or collaboration patterns, and communicate their work to non-expert audiences. For early-career researchers, the visualizations provide a clear view of how their research profile evolves over time, such as transitions from conference-focused outputs to more consolidated journal publications. For research groups, BibTexViz offers a bird’s-eye view of collective productivity and strengths.
BibTexViz is freely available online and can be used without installation. The project is under active development, with ongoing work on additional visual encodings, enhanced customization, and support for research communities beyond computer science. Future directions include integration with other open infrastructures such as Crossref [L8], OpenAlex [L9], and open scholarly resources like Semantic Scholar [L10], further strengthening its Open Science foundations.
By combining open bibliographic infrastructures, standardized reference formats, and carefully designed visualizations, BibTexViz demonstrates how open tools can meaningfully support researchers while remaining faithful to the values of Open Science and responsible research assessment.
Links:
[L1] https://bibtexviz.github.io
[L2] https://sfdora.org
[L3] https://www.coara.org
[L4] https://portaldelainvestigacion.uma.es
[L5] https://prisma.us.es
[L6] https://dblp.org
[L7] https://www.dagstuhl.de/en
[L8] https://www.crossref.org
[L9] https://openalex.org
[L10] https://www.semanticscholar.org
References:
[1] D. Hicks, et al., “The Leiden Manifesto for research metrics”, Nature 520, 429-431, 2015. https://doi.org/10.1038/520429a
[2] T. Munzner, “Visualization Analysis and Design”, CRC Press, 2014. https://doi.org/10.1201/b17511
[3] M. Zaumanis, “Research Data Visualization and Scientific Graphics: For Papers, Presentations and Proposals”, Peer Recognized, 2021.
Please contact:
Jose-Miguel Horcas
ITIS Software, Universidad de Málaga, Spain

