by Antonio Bruno, Giacomo Ignesti and Massimo Martinelli (CNR-ISTI)
Correct classification is the main aspect in evaluating the quality of an artificial intelligence system, but what happens when you reach top accuracy and no method explains how it works? In our study, we aim at addressing the black-box problem using an ad-hoc built classifier for lung ultrasound images.
In the last few years, the novelties of artificial intelligence (AI) and computer vision (CV) significantly increased, allowing new algorithms to obtain meaningful information from digital images. Medicine is a field in which the use of this technology is experiencing fast growth. In 2020, in the USA alone, the production of 600 million medical images was reported, and this number seems to increase steadily. Robust and trustworthy algorithms need to be developed in a multidisciplinary collaboration.
During the SARS-CoV-2 pandemic, a fast and safe response became even more necessary. The use of point-of-care ultrasound (POCUS) to detect SARS-CoV-2 (viral) pneumonia and the bacterial infection emerged as one of the most peculiar emerging case studies, involving the use of on-site ultrasound examinations rather than a dedicated facility. As well as being faster, safer and less expensive, lung ultrasound (LUS) also appears to detect signs of lung diseases as well as or even better than other methods, such as X-ray and computed tomography (CT).
The employment of lung POCUS seemed an optimal solution for both quarantined and hospitalised subjects. CT and magnetic resonance imaging (MRI) are far more precise and reliable examinations, but both have downsides over mass screening. In our study, an efficient adaptive minimal ensembling model was developed to classify LUS using the largest publicly available dataset, the COVID-19 lung ultrasound dataset [L1], composed of 261 ultrasound videos and images from 216 different patients. The General Data Protection Regulation (GDPR) and the European Committee AI Act focus on the intent that an AI-deployed system should be trustworthy and fully explainable.
Several explainability approaches arose from the scientific community and new ones are under development. Focusing on image interpretation, a debate about which approach should be used is ongoing. As the core model, we selected EfficientNet-b0 [1] because of its good accuracy/complexity trade-off.
The efficiency of this architecture is given by two main factors:
- the reduced number of parameters given by compound scaling, by which input scaling (i.e. input size), width scaling (i.e. convolutional kernel size) and depth scaling (i.e. number of layers) are performed in conjunction because they are dependent
- the low number of FLOPs (floating point operations) of the inverted bottleneck MBConv (first introduced in MobileNetV2, an efficient model designed to run on smartphones) as a main constituent block.
The greatest contribution of our study is given by the introduction of an ensembling strategy. Due to its resource-consuming nature and the exponential growth of model complexity, ensembling is scarcely used in computer vision, but we demonstrate how to perform it in an adaptive and efficient way:
- using only two weak models (minimality, efficiency)
- performing the ensemble using a linear combination layer, trainable by gradient descent (adaptivity)
- performing it using the features instead of the output, excluding redundant operations (efficiency)
- fine-tuning the combination layer only (efficiency).
The linear combination layer used to perform the adaptive ensemble can be described by the following equation:
Featcomb= Wcomb Featconcat + bcomb ,
where:
- Featconcat = featweak1 ∙ featweqk2 is the concatenation of the weak features
- featweak1, featweak2 are the features obtained by the two weak models.
Table 1 shows that the ensemble further reduces the variance and improves the generalisation power (i.e. performance on validation and test dataset), outperforming the state-of-the-art (SOTA) with lower complexity (moreover, the complexity of this ensemble strategy is equal to the complexity of a single EfficientNet-b0, since the processing of the weak models is independent and parallelised).
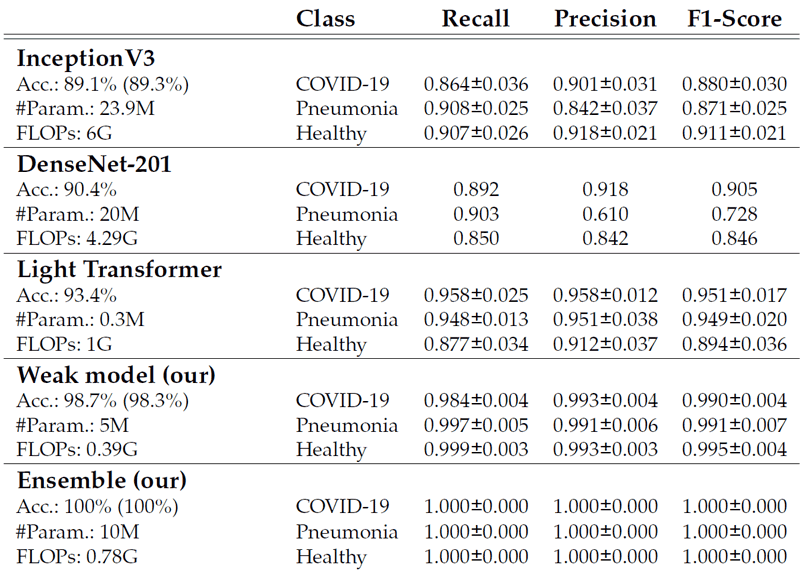
Table 1: Test set comparisons (on 5-fold cross-validation), with metrics for each class, of the proposed model with the SOTA. Our solution outperforms the SOTA on all metrics and has the lowest complexity.
Even if our model can give extremely accurate and fast responses, it is crucial that it also is secure and understandable. To this aim, we applied Grad-CAM, since this method uses gradients with respect to a particular convolutional feature map (in our case the last convolutional layer of the model) to identify the regions on the input that are more discriminative for the classification results (i.e. higher gradient value means higher contribution to the classification).
The application of this technique to our model gives reasonable results. A first non-trivial result is that for the images classified in the same way, a similar gradient is activated, which in turn originates from similar areas in the images. This result was further investigated by comparing the saliency map of the same correctly classified images between the EfficientNet-b0 and the ensemble models. While both identify similar parts, the ensemble model seems to maintain attention on a more concentrated area.
Figures 1, 2 and 3 show that there are typical signs of evidence for each class:
- COVID-19 (Figure 1) – usually, more concentrated and relatively large, mainly over the pleural line and on the "edges"
- Pneumonia (Figure 2) – evidence mainly below the pleural line, with widespread area having spots
- Healthy (Figure 3) – mainly the very expanded, healthy part of the lung (black).
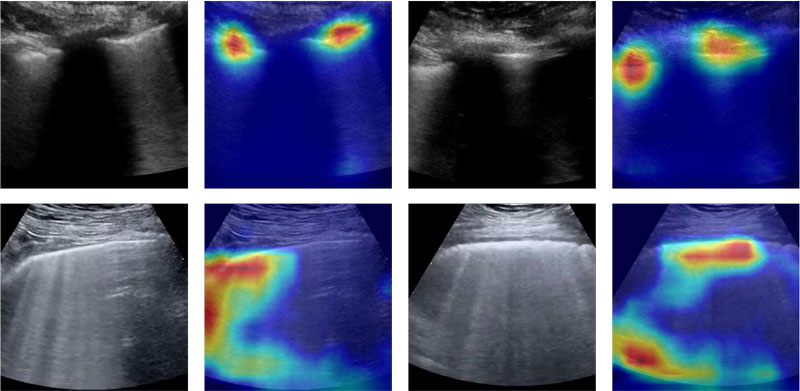
Figure 1: COVID-19 – Original and Grad-CAM-processed samples are shown for subjects with COVID-19; different images within different subjects show similar activation maps.
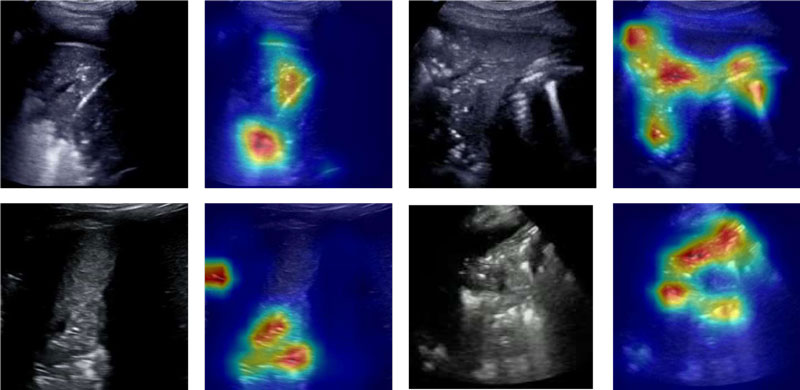
Figure 2: Pneumonia – Original and Grad-CAM-processed samples are shown for subjects with pneumonia; the attention of the classifier is on different regions of the images in contrast to the other two classes.
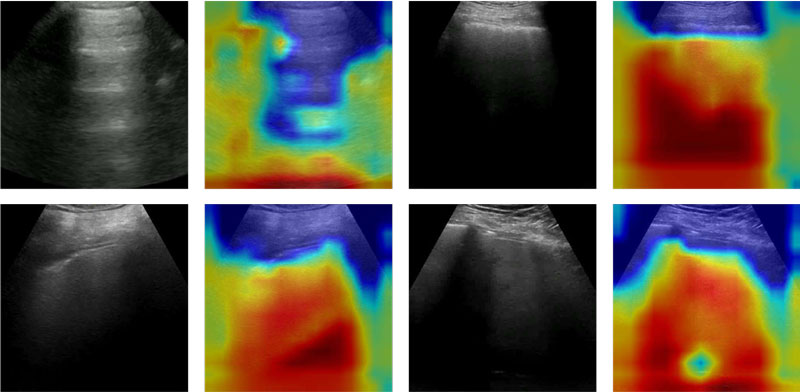
Figure 3: Healthy – Original and Grad-CAM-processed samples are shown for healthy subjects; the classifier focuses its attention all over the image or outside; it seems it does not find relevant information, unlike the cases with a pathology.
Even if this study seems to provide robust and interpretable results, it lacks in-depth research on the effective stability of the explanation. To further test our method, in an ongoing telemedicine project [2], in close collaboration with specialist sonographer staff, we are going to use further explainability methods on other important signs that can be present in LUS (e.g. A-lines, B-lines, thickness), in order to improve the correlation with the ground truth.
Link:
[L1] https://github.com/jannisborn/covid19_ultrasound/blob/master/data/README.md
References:
[1] Mingxing Tan and Quoc V. Le, “EfficientNet: rethinking model scaling for convolutional neural networks,” Proceedings of Machine Learning Research, vol. 97, pp. 6105–6114, 2019. Available at: http://proceedings.mlr.press/v97/tan19a.html
[2] G. Ignesti et al., “An intelligent platform of services based on multimedia understanding and telehealth for supporting the management of SARS-CoV-2 multi-pathological patients,” in Proc. 16th International Conference on Signal-Image Technology & Internet-Based Systems (SITIS), 2022, pp. 553–560. Available at: https://doi.org/10.1109/SITIS57111.2022.00089
Please contact:
Massimo Martinelli, CNR-ISTI, Italy

