by Mahmoud Jaziri (Luxembourg Institute of Science and Technology) and Olivier Parisot (Luxembourg Institute of Science and Technology)
AI is an indispensable part of the astronomer's toolbox, particularly for detecting new deep space objects like gas clouds from the immense image databases filled every day by ground and space telescopes. We applied explainable AI (XAI) techniques for computer vision to ensure that deep sky objects classification models are working as intended and are free of bias.
Recently, deep neural networks became state of the art in many fields, outperforming domain experts in some cases. With EU regulation (GDPR and the future AI Act), explainable AI (XAI) has become a hot-topic issue. It is also important for the scientific community. Whether it is classifying new quasars or detecting new gas clouds, astronomers need AI to automatically process millions of deep sky images. But how can we be sure of an AI model’s accuracy? And how can we prove that there is no bias in the data, or the implementation?
We have tested classification methods on astronomical images during the MILAN project, funded by the Luxembourg National Research Fund (FNR), grant reference 15872557. To this end, we have trained models to classify deep sky objects (galaxies, nebulae, stars clusters, etc.). Based on VGG16 and ResNet50 architectures, we have applied these models on images captured with smart telescopes [1].
Two XAI approaches were investigated: a global one attempting to explain the entire AI model’s decision-making process, and a local one that explains a single prediction. Each approach satisfies a certain need in the XAI debate. Respectively offering insight into which features are overall most important (e.g. for predicting heart disease); or getting into the details of a single prediction, offering insight into which features are most important for the investigated output. This is the most used approach in computer vision [2] and the one that we will be discussing.
Some techniques attempt to trace a neural network’s output back through its layers and gauge its “sensitivity” to certain image features. These methods are appropriately called gradient-based methods, e.g. guided backpropagation (GBP), integrated gradients (IG), concept activation maps (CAM), layer-wise relevance propagation (LRP) and DeepLIFT (Deep Learning Important FeaTures). Some try to selectively perturb a neural network, by adding noise to the input, modifying or removing subsets of neurons or features, then recording the network’s output and inferring their importance. This leads to the construction of an “attribution map” on which the most important features have higher importance scores. These perturbation-based methods are often combined with gradient-based techniques to produce two of the most popular techniques used:
- SHAP (SHapley Additive exPlanation) assigns importance to features based on their average contribution to every possible subset of features.
- LIME (local interpretable model agnostic explanations) creates an interpretable simpler model, called surrogate, such as a logistic regression or a decision tree to serve as a local approximation to the original model, reducing the difficulty of interpretation enough for human understanding.
Individually these techniques are inherently flawed, and the extent of their validity is limited [3]. Some methods are blind to a feature with maxed-out contribution, i.e. locally, the output is not “sensitive” to the feature, therefore it is considered unimportant despite its criticality for the correct prediction. Other methods produce different attribution maps for functionally equivalent neural networks. Most are vulnerable to manipulation, mapping on the same image – the same explanation for different outputs, or different explanations for the same output prediction. Furthermore, they are heavily dependent on hyper-parameters (e.g. the number of samples) and the training data biases.
Overall, the discussed techniques provide explanations that are too brittle and could lead to a false conclusion about the model’s performance. Solving this problem has recently taken the XAI community into an exciting new direction researching the robustness of AI explanations. It posits five axioms and their mathematical formulations to evaluate the quality of an explanation technique by measuring its ability to deal with the discussed limitations. Respectively to the mentioned flaws, these axioms are: saturation, implementation invariance, fidelity, input invariance, and sensitivity [3]. Though there is no consensus on which XAI technique best satisfies these axioms, the trend is to mix and match different techniques making them inherit each other’s robust qualities. This has led to new techniques such as LIFT-CAM, Guided CAM, Smooth IG, etc.
The robustness of an explanation is measured by evaluating the similarities between two attribution maps: a reference attribution map from an unperturbed image, and that of a perturbed image.
Evaluating the two images relative to each other gives us a great overview of the performance of our explanation method on the defined five axioms. To do so, several visual metrics like SSIM (structural similarity index measure) help in this evaluation, resulting in explanations closely coherent with the human visual intuition [2]. In fact, the robustness of an explanation and the model itself are closely related, e.g. the non-smooth decision boundaries of a neural network make its attribution map vulnerable to small natural perturbations in input. In an ideal world, the attribution maps should be sensitive enough to detect noise but immune to their effects.
When applying these XAI techniques on our deep sky objects classification models, we obtained attribution maps which highlight the image regions considered most important by the classification model (see Figure 1). Vanilla Gradient shows the pixels the model is sensitive to, and SmoothGrad denoises the attribution map to moderate use (two clusters for the two galaxies). XRAI’s segmentationmethod produces better results, accurately detecting the centre and shape of the bigger galaxy, but less so the second smaller galaxy. However, across the methods used, there is a small unwanted bias in the model to use low-light corners. In future works, we will continue to refine our classification model architectures to find a satisfying trade-off between accuracy and interpretability.
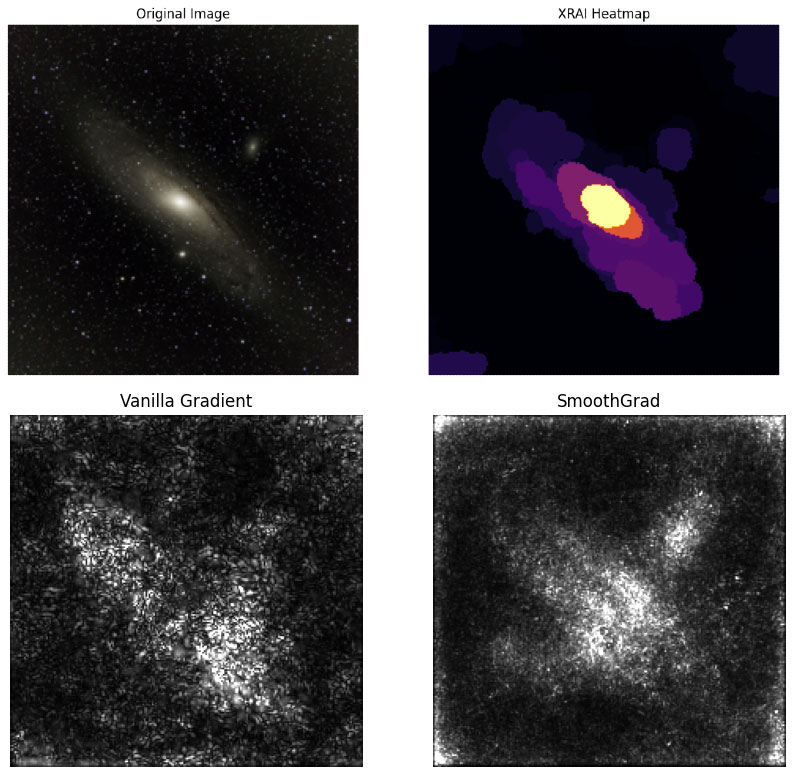
Figure 1: the first image represents the Andromeda Galaxy (M31) captured with a smart telescope (top left). The other images are the output of different approaches to explain the detection of deep sky objects with a TensorFlow VGG16 classifier.
Link:
[L1] https://www.list.lu/en/news/high-quality-noise-free-astronomical-images/
References:
[1] O. Parisot, et al., “MILAN Sky Survey, a dataset of raw deep sky images captured during one year with a Stellina automated telescope,” Data in Brief, vol. 48, 2023, Art. no. 109133.
[2] M. V. S da Silva, et al., “Explainable artificial intelligence on medical images: a survey,” arXiv preprint arXiv:2305.07511, 2023.
[3] I. E. Nielsen, et al., “Robust explainability: a tutorial on gradient-based attribution methods for deep neural networks,” in IEEE Signal Processing Magazine, vol. 39, no. 4, pp. 73–84, Jul. 2022, doi: 10.1109/MSP.2022.3142719.
Please contact:
Mahmoud Jaziri, Luxembourg Institute of Science and Technology, Luxembourg
Olivier Parisot, Luxembourg Institute of Science and Technology, Luxembourg

