


by Olivier Parisot, Philippe Pinheiro and Patrik Hitzelberger (Luxembourg Institute of Science and Technology)
“Decision Management System for Safer Spacecrafts” (DMSS) is a data analytics platform for the space domain that can detect anomalies in huge telemetry data acquired from numerous sensors in a complex IoT architecture.
Processing telemetry data is a challenge in any IoT architecture [1]. In the space sector, monitoring remote sensors is a common problem. The recent increase in downlink bandwidth and available processing power on spacecrafts have resulted in an increase in the number and the volume of telemetry measurements available to spacecraft controllers to monitor the health and safety of a spacecraft. In practice, the number of maintenance parameters is generally in the tens of thousands range. While providing a wealth of diagnostic information, these huge numbers overwhelm the ability of the human brain to oversee all telemetry measurements. Automatic checks and computer-aided data analysis can provide a daily overview for spacecraft operators and operations engineers.
In order to efficiently operate satellite constellations as well as spacecrafts, the Luxembourg Institute of Science and Technology [L1] and the Institute of Astronomy of KU Leuven [L2] have developed the “Decision Management System for Safer Spacecrafts” (DMSS) platform for the European Space Operations Centre (ESOC), the main mission control centre of the European Space Agency (ESA). DMSS offers a self-learning visual platform for anomaly detection in telemetry data coming from embedded sensors.
Based on complex data analytics algorithms [2], DMSS follows a visual analytics approach [3], providing interactive and visual representations of telemetry data and derived computational data. These representations come in the form of diagrams, such as Poincaré plots, KDE schemas, Heat maps, and time series plots (Figure 1), which are interactive and connected: choosing data in one diagram highlights corresponding data in another related diagram.
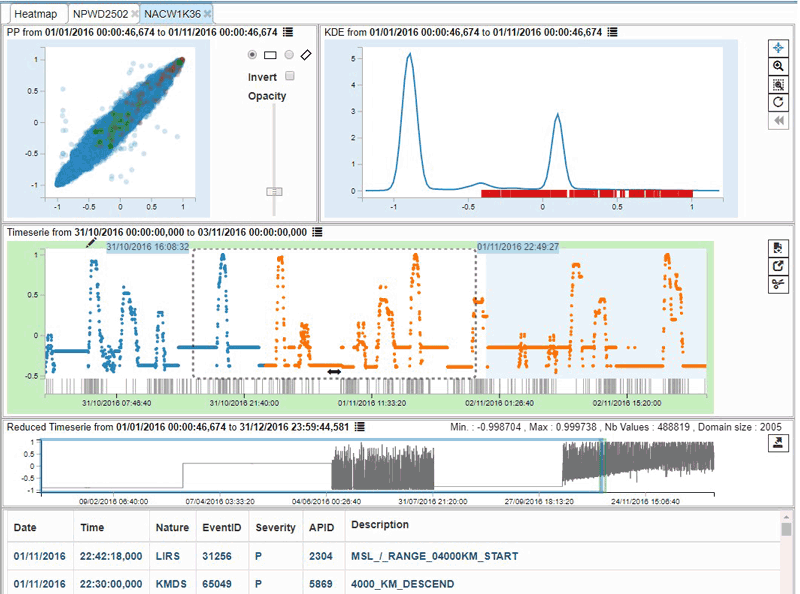
Figure 1: DMSS provides a dashboard to show telemetry data coming from remote sensors.
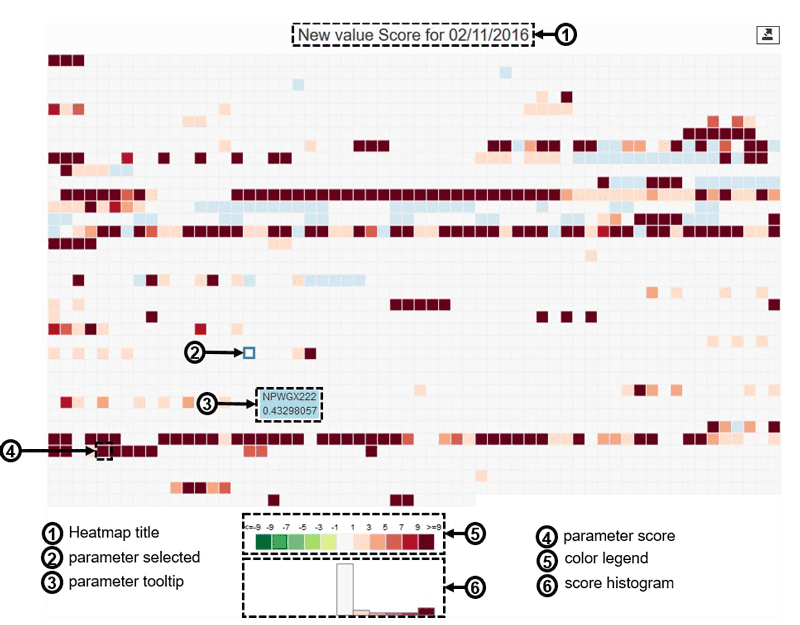
Figure 2: The heat map helps to the potential anomalies in telemetry data coming from these sensors.
To help monitor the sensors, the main screen of DMSS presents a heat map displaying all telemetry anomaly scores for a specific day (Figure 2). The goal is to quickly identify which telemetry parameters potentially show an unusual behaviour:
- Blue means that no anomaly score was calculated for this date (due to missing or incomplete data – which is common with telemetry data from remote sensors).
- Grey means that the anomaly score is zero, thus the corresponding parameter has a standard behaviour for the selected date.
- Red means that the anomaly score is positive, this parameter has an uncommon behaviour; the user should click on it to see more details and investigate whether it is due to a real anomaly.
- Green means that the anomaly score is negative. Negative scores may occur for some score types when the anomaly score was previously positive and now the scoring system detects that the parameter behaviour is coming back to normal.
With this view, end-users can see if a group of telemetry parameters has a high anomaly score and see if one specific telemetry parameter has a high score compared to other similar telemetry parameters.
As a use-case, the data from two space missions operated by the European Space Agency were analysed: Mars Express (5,127 telemetry sensors i.e. 141 GB of data) and GAIA (28,209 telemetry sensors i.e. 1.46 TB of data for GAIA - including raw time series and statistical pre-calculations). For example, the number of points per time series is very variable, from a few samples up to 13 million samples. DMSS was able to display the potentially detected anomalies for the Mars Express mission. It also helped expert users to visually explore this important amount of data in a new way and try to find correlations between a potential detected anomaly and other parameters like events or commands sent to the spacecraft.
To conclude, DMSS helps to analyse large volumes of time series data coming from spacecraft sensors - which is a typical scenario for IoT applications. In this use case, operational risks are high, and efficient support of spacecraft operator engineers is of paramount importance. It is therefore crucial that software architecture and semi-automatic data analytics support perform efficiently and reliably. We anticipate that the approach could be applied to a large extent in other IoT scenarios.
Links:
[L1] https://www.list.lu/en/cooperations/lines-of-business/space/
[L2] https://fys.kuleuven.be/ster
References:
[1] Lazarescu et al.: “Design of a WSN Platform for Long-Term Environmental Monitoring for IoT Applications”, https://doi.org/10.1109/JETCAS.2013.2243032
[2] Royer et al.: “Data mining spacecraft telemetry: towards generic solutions to automatic health monitoring and status characterisation”, https://doi.org/10.1117/12.2231934
[3] Keim et al.: “Visual analytics: Definition, process, and challenges”, https://doi.org/10.1007/978-3-540-70956-5_7
Please contact:
Olivier Parisot, Philippe Pinheiro, Patrik Hitzelberger
Luxembourg Institute of Science and Technology

