


by Adam Agocs, Dimitris Dardanis, Richard Forster, Jean-Marie Le Goff, Xavier Ouvrard and André Rattinger (CERN)
Collaboration Spotting (CS) is a visualisation and navigation platform for large and complex datasets. It uses graphs and semantic and structural data abstraction techniques to assist domain experts in creating knowledge out of big data.
Valuable knowledge, which can help to solve a range of complex problems, may be created from the extremely large amount of data generated by computers and the internet of things. To achieve this, we rely on sophisticated cognitive tools whose efficacy strongly depends on the delicate interplay between domain experts and data scientists. Domain experts trust data scientists to deliver the tools they need, while the effectiveness of these tools in supporting knowledge creation essentially depends on the information in the hands of domain experts. In other words, creating knowledge essentially relies on the capability of combining domain specific semantic information with concepts extracted out of the data and visualising the resulting networks.
Storing large networks in a flexible and scalable manner calls for graphs: mathematical objects that hold information in nodes representing data instances of particular categories – called facets – and in relationships characterising the network interconnectivity. Facets and relationships embody the network schema, a semantic abstraction of the network content and structure.
Enhancing the cognitive insight of humans into the understanding of the data calls for visual analytics: the science of analytical reasoning supported by interactive visual interfaces that combines the power of visual perception with high performance computing.
Collaboration Spotting (CS) is a data-driven platform based on open source software packages that uses visual analytics concepts and advanced graph processing techniques to provide a flexible environment for domain experts to run their analysis. CS is domain independent and fully customisable. It gives data scientists the capability of building multi-faceted networks out of multiple and heterogeneous data sources and domain experts the ability to specify different perspectives for conducting their analysis by means of network schemas. Individual analysis outputs are visualised in graphs using node-link representations where node size, colour and shape, and relationships highlight the network contents and structures. Output graphs are perspective specific. They represent faceted views of the network under study articulated around part or all of its content. A sophisticated navigation system enables users to graphically interact with individual output graphs and reach other facets of the network. Advanced structural abstraction techniques tailored to graph complexity and size give domain experts a visual access to fine structures and particularities, such as communities and outliers in a clear manner even for reasonably large graphs. Applying these techniques in hierarchies of graphs provides visual access to larger output graphs at the cost of a loss of semantic and structural information.
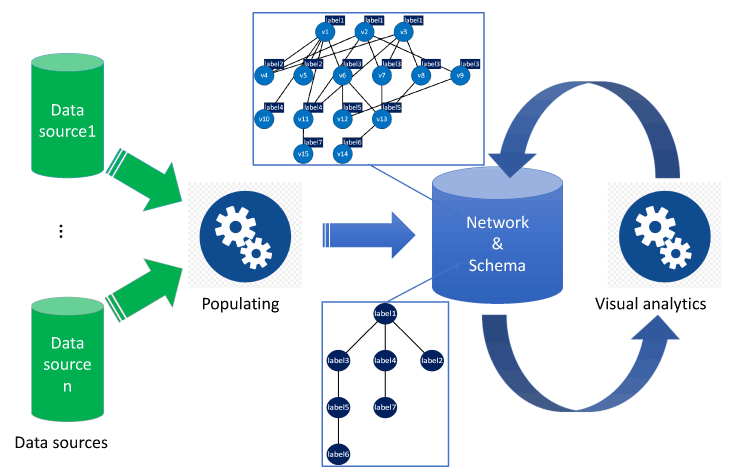
Figure 1: The Collaboration Spotting conceptual framework. After populating the database, domain experts analyse the network content with the help of the schema.
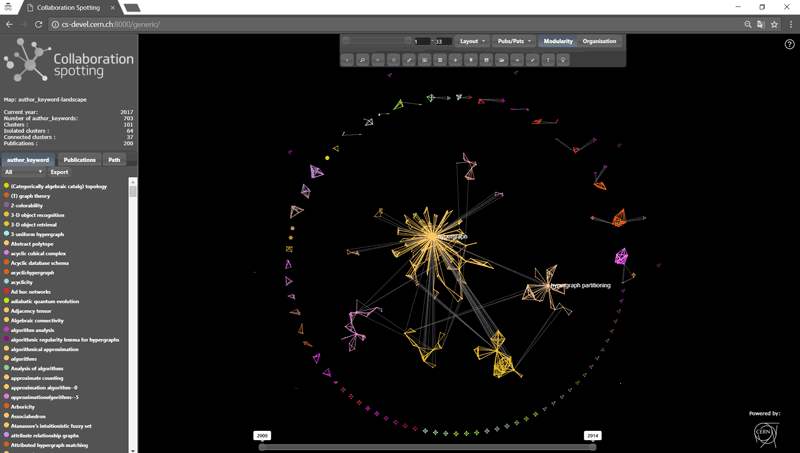
Figure 2: View of an analysis output depicting a network of publications from the keyword perspective. Vertices in italics represent keywords merged together and the others single-keywords. Coloured clusters highlight groups of keywords that are found more often together in publications.
Responsiveness when servicing users is an essential aspect of visual analytics. To this end, the CS team has paid particular attention to optimising all the time-critical aspects of the platform. Networks are stored in graph databases that support efficient and flexible query mechanisms. The computing of output graph structures with optimized visual perception is done using scalable clustering and rendering algorithms that run on large computing infrastructures and open source cloud computing software.
CERN has developed Collaboration Spotting with the initial aim of providing the particle physics community with intelligence on academia and industry players active around key technologies with a view to fostering more interdisciplinary and inter-sectorial R&D collaborations, and giving procurement at CERN the opportunity of reaching a wider selection of high-tech companies [L1]. CS concepts and techniques have been used for building the Technology Innovation Monitor (TIM) of the EC Joint Research Centre (JRC) [L2] and visualising compatibility and dependency relationships in software and metadata of the LHCb experiment at CERN [L1]. A collaboration with Wigner MTA and Budapest University of Technology and Economics (BME), Hungary is now in place to explore the use of CS in the areas of: (i) pharmacoinformatics as a supporting tool for knowledge-based drug discovery using analytics over linked open data for the life sciences [L3]; (ii) IT-analytics as a tool to enhance large-scale visual analysis of performance metrics of algorithmic and infrastructure components [L4]; (iii) neuroscience to assist in understanding the structural and functional organisation of the brain [L5]; and (iv) in social sciences as a research tool to study a database of European and international higher education institutes with the goal of developing new metrics to describe their performance (BRRG) [L6].
From the experience acquired with the prototypes, we plan to further develop the CS platform to provide optimized visual perception in order to enhance cognitive insights regardless of the size of the networks. These new developments will be tested at CERN and at the Wigner GPU laboratory.
Links:
[L1] collspotting.web.cern.ch/
[L2] timanalytics.eu/
[L3] bioinformatics.mit.bme.hu/UKBNetworks/
[L4] inf.mit.bme.hu/en/research/directions
[L5] kwz.me/hT6
[L6] kwz.me/hT7
Please contact:
Jean-Marie Le Goff, CERN, Switzerland
+41 22 767 6559,

