


by Maria Girardi (CNR-ISTI), Gianmarco Gurioli (University of Florence), and Nicola Messina (CNR-ISTI)
Monitoring systems constitute a significant, non-invasive tool for verifying the structural health of buildings and infrastructure over time. Deep learning neural networks can be used to analyse data from long-term monitoring systems, such as time series of velocity/acceleration measured at specific points and environmental parameters, and to predict the main features of the buildings’ structural behaviour with respect to ambient stresses. Potential anomalies of the structure’s vibrational features related to damage or unexpected events, such as earthquakes or exceptional loads, can also be detected. The paper focuses on the application of a Temporal Fusion Transformer (TFT) network to data from the dynamic monitoring of a medieval tower in the historic centre of Lucca (Tuscany, Italy).
The Guinigi Tower (Figure 1) is an iconic medieval monument in the historic centre of Lucca. The dynamic response of this structure to ambient vibrations from the surrounding environment (traffic, wind, earthquakes, crowds and tourists visiting the tower and the nearby monuments) was continuously recorded by a sensor network comprising high sensitivity velocimeters, able to capture small movements at various points of the tower. The experiments lasted about one year, with the tower’s velocities recorded at a sampling frequency of 100 Hz. The resulting dataset was used to train a TFT network [1], [L1] and to predict the tower’s dynamic behaviour [2]. In particular, the training set was made of the first six natural frequencies of vibration of the tower, extracted from the data every hour of the monitoring period, together with the Root Mean Square (RMS) of the signals and the primary environmental parameters recorded at the tower or in the neighbourhood. The target values are the future frequencies and the RMSs. A change in the frequencies and/or the energetic content of the signal (RMSs) represents an anomaly in the dynamic behaviour of the tower and can be attributed to peculiar events (earthquakes, storms etc.) or exceptional loads. Permanent changes in these quantities can be associated with structural damage. TFT-based monitoring strategy detects when and how much the observed (experimental) values of the targets exceed the confidence interval predicted by the algorithm.
Figure 1 shows the anomaly plots of the first five natural frequencies of the tower (middle) and the RMSs (hourly values) of the signal in the horizontal direction, recorded by one of the seismometers installed over the tower’s top. The anomaly plots show the observed values (orange lines), the values predicted by the TFT (blue lines – 50th percentile), and the predicted 1-99th confidence interval (grey areas). The vertical bars indicate when one of the observed targets exceeds the predicted confidence interval, thus indicating an anomaly in our framework. A suitable score is defined to visualise the magnitude of the anomalies via the colour map shown at the bottom. The anomaly score, ranging from 0 to 1, quantifies how much the observed target falls outside the confidence interval predicted by the network. Specifically, it reaches the maximum value of 1 when the observed measurement exceeds the estimated interval size of a percentage not smaller than 100%.
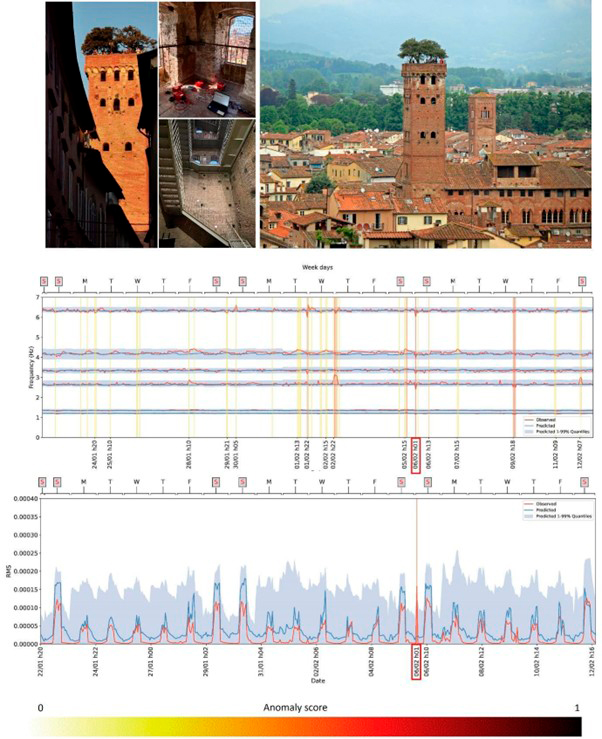
Figure 1: The Guinigi Tower (top). Anomaly plots of the frequencies (middle) and RMSs (bottom). Observed values (orange), predicted values (blue), predicted confidence intervals (grey areas).
The anomaly plot of the frequencies in Figure 1 shows several events, the most significant of which is the Viareggio earthquake (06/02/22, 1:36 UTC, Magnitude = 3.7 [L2]), which happened about 20 km from Lucca. As illustrated by the figure, the anomaly induced by the earthquake is detected by the algorithm in every one of the tower's frequencies and by examining the RMSs. After the event, the values of the frequencies and RMSs came back to normality, thus indicating that the earthquake did not permanently damage the tower's structure. The anomaly plot of the RMSs is also meaningful: the daily increase in the signal's energy, which is well predicted by the algorithm, is related to the presence of the visitors on the tower during the day (the number of tickets sold per hour is included for training the algorithm). The algorithm output correlates well with the increase in weekend visitors, marked in the figure by the Saturday-Sunday capital letters.
The authors also explored the potential of TFT to forecast the dynamic behaviour of heritage buildings using the datasets recorded at the San Frediano Bell Tower in Lucca [3] and the Matilde Donjon in the Medicean Port of Livorno. Leveraging the network's internal features to automatically classify different anomaly categories and damage levels is a worthwhile future perspective for fully automated applications in structural monitoring.
Links:
[L1] https://pytorch-forecasting.readthedocs.io/
[L2] https://itaca.mi.ingv.it
References:
[1] B. Lim, et al., “Temporal fusion transformers for interpretable multi-horizon time series forecasting”, in Int. J. of Forecasting, 37(4), pp.1748-1764, 2021.
[2] F. Falchi, et al., “Deep learning and structural health monitoring: Temporal Fusion Transformers for anomaly detection in masonry towers”, in Mechanical Systems and Signal Processing, 215, 111382, 2024.
[3] F. Carrara, et al., “Deep learning for structural health monitoring: An application to heritage structures”, in Materials Research Proc., 26, pp. 581–586, 2023.
Please contact:
Maria Girardi, CNR-ISTI, Italy

