


by Marco Sozzi, Donato Cillis, Francesco Marinello and Luigi Sartori (University of Padova, Italy)
Precision agriculture tools can be of benefit to low-intensity tillage systems. This study investigates spatial variability in a conservative tillage system using proximal sensors and satellites.
Efficient and reliable methods for measuring spatial variation in soil properties are fundamental to precision farming. Over the last decade, geophysical sensors based on non-destructive measurement of soil electrical conductivity (or its inverse, resistivity) have been extensively used in precision agriculture. Different potential patterns provide information on subsurface and its electrical properties. The electrical resistivity of the soil can be considered as a proxy for the variability of a soil’s physical features including texture, type and moisture. At the same time, satellite and airborne sensors offer an increasing amount of information about soil properties and ground cover. In particular, vegetation indices, based on remotely-sensed spectral reflectance in the near-infrared and visible bands, have been widely used for monitoring vegetation [1]. The study investigates the potential to monitor the evolution of the vegetation index to modulate the agricultural operations on soft wheat (Triticum æstivum L.).
In the present work a survey on soil and vegetation variability, coupling a multi-depth automatic resistivity profiler (ARP©, Geocarta, France) [2] and Normalized Difference Vegetation Index (NDVI) as derived from Sentinel-2 imagery data. The analysis was based on a relationship between resistivity and NDVI index. The study was carried out in the 2015-2016 season in a farm located in Caorle (VE) – Veneto, Italy (45.63°N 12.95°E). Wheat cultivation was managed with three different soil tillage systems, characterised by different tillage intensity: conventional (CT), minimum (MT) and no-tillage (NT). Each plot was 1.5 ha in size. The ARP system was pulled through the field to collect data at three different depths simultaneously (0-0.5 m, 0-1 m and 0-2 m). Data were real-time referenced by differential global positioning system (DGPS). On the other hand, NDVI vegetation index was assessed using Sentinel-2 mission’s satellite images. To obtain information during the representative stages of the crop cycle, five satellite images, from 20 January 2016 to 30 March 2016, were considered. Images were chosen selecting only low noise scenes, excluding those affected by clouds or fog. Soil spatial variability was analysed processing three depth levels ARP data using the statistical software MZA (Management Zone Analyst, University of Missouri-Columbia [3]), which implements a fuzzy c-means unsupervised clustering algorithm that assigns field information into like classes. To perform the analysis, NDVI and ARP data were re-sampled building a 10×10 m reference grid. Finally, soil resistivity and vegetation index maps were correlated dividing ARP values into classes representing step values of resistivity of 5 Ohm∙m, falling in the reference management zone managed by different tillage systems.
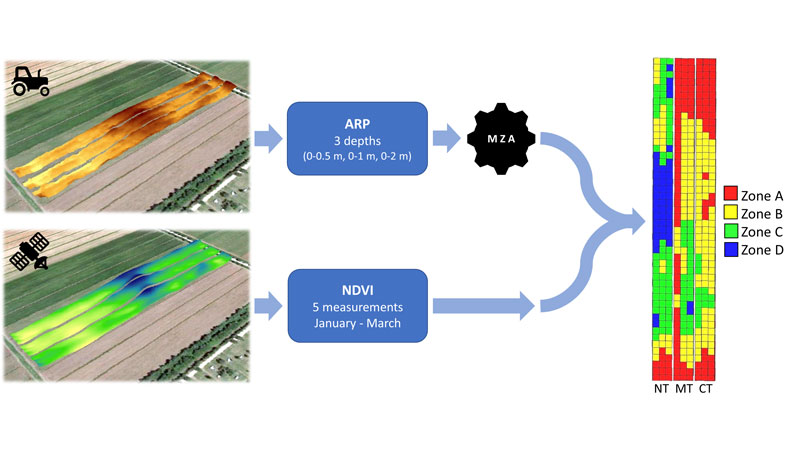
Figure 1: Summary of the applied process.
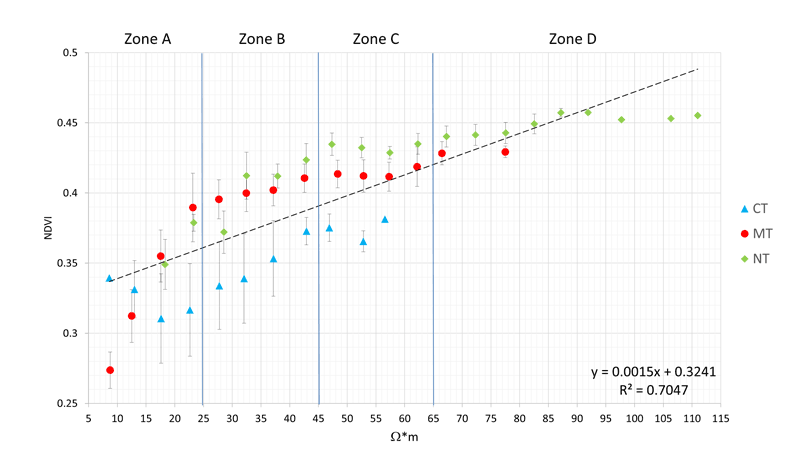
Figure 2: Correlation between ARP and NDVI for tillage system and management zone.
As a result, four homogeneous classes were identified after the MZA analysis: three of them cover all the tillage systems, while the fourth zone affects only the side of the field managed with MT and NT. Such homogenous zones (namely A, B, C and D) are characterised by increasing ARP values. Soil resistivity showed high variability in terms of soil features, in fact, a wide range of resistivity was observed. High resistivity levels characterise sandy soil with high water drainage (zone D), while low resistivity levels are typical of clay soil with high salinity (zone A) that can occur in a stagnant condition if affected by soil compaction. Besides, to increase the confidence and the level of information on the experimental area, the average of the five dates’ NDVI data was taken into consideration. A clear correlation can be detected between soil features and vegetation vigour, as reported in Figure 2. Increases in ARP value correspond to high vegetation vigour, expressed by NDVI. In addition, it is possible to observe the NDVI temporal trend of the single homogeneous zones under different soil tillage systems. Correspondingly, the contribution of the soil tillage technique on NDVI index and the influence on soil features can be investigated. CT shows lower NDVI than MT and NT for all homogeneous zones. This is caused by its features: indeed, CT tends to cool soil faster than MT and NT. In addition, continuous inversion of soil layer leads to a decrease in soil fertility and nutrients availability. Finally, the higher number of passages distinguishing CT for the seedbed preparation could affect soil compaction leading to a stress condition for subsequent plant growth, especially in the field characterised by clay soil. Conversely, MT and NT do not involve inversion of soil layer and require a lower number of passages across the field. Besides, their features lead to a mitigation of soil cooling phenomena allowing fast seed germination. Zones with low resistivity are characterised by high variability of the NDVI measurements, due to the cooling phenomena at the beginning of the crop cycle.
This study has been performed under the framework of the AGRICARE project - Introducing Innovative Precision Farming Techniques in Agriculture to Decrease Carbon Emissions, supported by the European Commission – DG Environment through the LIFE+ programme; under contract number LIFE13 ENV / IT / 000583.
References:
[1] P. Gong et al.: “Finer resolution observation and monitoring of global land cover: first mapping results with Landsat TM and ETM+ data”, Int. J. Remote Sens., 2013.
[2] D. Cillis, et al.: “Field-scale electrical resistivity profiling mapping for delineating soil condition in a nitrate vulnerable zone”, Appl. Soil Ecol., 2017.
[3] J. J. Fridgen, et al.: “Management Zone Analyst (MZA)”, Agron. J., 2004.
Please contact:
Marco Sozzi, TeSAF Department, University of Padova, e-mail:

