by Corine Laan (Amsterdam University of Applied Sciences) and Nanda Piersma (Amsterdam University of Applied Sciences and CWI)
Parks are necessary for sustainable urban vitality. We studied the optimal availability of parks by combining open data sets with polygons and classification frameworks from urban planning literature. Both distance and population density should be considered as measures of availability when planning urban parks.
Urban green spaces may have a historic origin or be planned in cities for purposes such as maintaining biodiversity, recreation, health, climate control, amelioration of air pollution and fire protection. Parks and their facilities may be owned and maintained either by municipalities or private parties. Studies show a positive relationship between the availability of parks and the health and the wellbeing of residents.
The evaluation of urban green space has been studied from different perspectives, including city planning, user appreciation, availability and accessibility, and its function in the urban context. Many case studies from these perspectives have given city planners and municipalities tools to manage urban green spaces in their cities.
The classification and evaluation of urban green spaces has commonly accepted indicators such as availability and accessibility [R1]. Availability is defined here as a quantification of green spaces (in size and distance) without consideration of public availability or proximity to residential locations (WHO2016). Accessibility is defined as a quantification of green space availability to general or specified public groups in relation to distance, expressed in service radius, or neighbourhood green index.
With the availability of more and new data sources on green urban areas, the classification framework for urban green spaces can be further developed and detailed. Global data also enables the framework to be generalised and standardised to overcome case-specific city characteristics.
In our research, we include the park size and population density within the catchment area of the parks as an indicator of availability of urban parks. The case study of Amsterdam shows that including park size and population density provides a radically different availability score of parks.
The indicators are modelled in an interactive dashboard for the Amsterdam case.
The Amsterdam case
We use open data, provided by the Municipality of Amsterdam, and consider urban parks that are open to the public and maintained by the municipality. The parks are denoted by polygons in line with another data set from the Copernicus urban atlas data for Europe [L1]. The polygons are plotted on a 100 x 100 m grid of the city of Amsterdam. The population size for each grid cell is available from Central Bureau of Statistics, the Netherlands [L2]. A total of 21.81 km2 green space exists within the city borders of Amsterdam, representing 9.93% of Amsterdam’s total area.
The model
Amsterdam is famous for its canals in the inner city and waterways in all neighbourhoods, features that need to be considered when calculating travelling distances. The distance to a park is therefore measured by calculating the actual walking distance from the centre of a grid cell to the nearest edge of the polygon of the park, using OpenStreetMaps.
The catchment area is defined as all grid cells within P metres walking distance of a park polygon, with P having values of 900, 750 or 500m.
The population density of a park is measured by the total population of the catchment area of a park, divided by the size of the park (population/m2). A second parameter Q is used as a threshold of desired population density, with values of 0.05, 0.5 and 1.
We show the catchment area of each park in Amsterdam within P metres walking distance and with park density below Q. With a value Q > 5 (maximum population density), the park density parameter is inactive, since all parks are taken into account.
Results
Figure 1 shows the catchment areas for P = 750 and Q = 0.05 and Q = 0.5. The catchment area of parks consists of 64% of the grid cells. If we include population density, this number decreases to 59% with a density of 0.5 and to 45% for a density of 0.05. As a percentage of the population of Amsterdam the catchment area of parks is 83%, but only 69% of the people are within 750 meters of a quieter park (density 0.05).
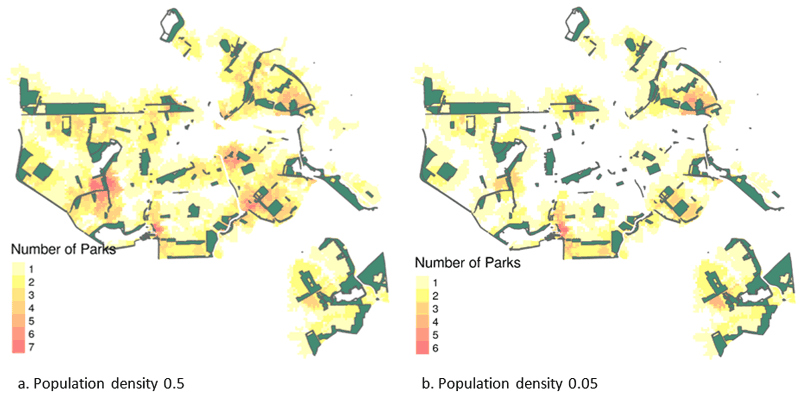
Figure 1: Locations in Amsterdam near a park. The left shows the number of parks within 750m with 2m2 space per person and the right with 20m2 per person. This shows that the inner city has some parks in the immediate surroundings whereas suburbs have multiple parks in close range. However, the parks near the inner city are very busy since they are also used by residents of the suburbs.
This research is part of the joined Urban Analytics program of the CWI and AUAS. Current work is incorporating the parks’ facilities, such as restrooms, catering, picnic areas and sports facilities. The accessibility to parks in relation to the available facilities is relevant. It gives a better insight into accessibility of parcs taken into account the population density of a park and park users’ intention for visiting parks. New research will also include a comparison with other European cities.
Links:
[L1] https://land.copernicus.eu/local/urban-atlas
[L2] https://www.cbs.nl/nl-nl/dossier/nederland-regionaal/geografische-data/kaart-van-100-meter-bij-100-meter-met-statistieken
Reference:
[1] Gupta, Kshama and Kumar, Pramod and Pathan, S. K. and Sharma, K. P., 2012, Urban Neighborhood Green Index - A measure of green spaces in urban areas, Landscape and Urban Planning, Vol 105, nr 3, 325-335, https://kwz.me/h4S
Please contact:
Corine Laan
Amsterdam University of Applied Science, The Netherlands
Nanda Piersma
Amsterdam University of Applied Science, and CWI, The Netherlands


