by Pieter Bons, Robert van den Hoed (Amsterdam University of Applied Sciences) and Nanda Piersma (Amsterdam University of Applied Sciences and CWI)
Smart charging protocols for electric vehicles can help avoid overload and instability in the electrical distribution network and can increase the proportion of locally generated solar energy used for charging. Our results show that the impact of smart charging depends heavily on the technical charging characteristics of the target vehicle.
Electric mobility is developing at a rapid pace, led by a few European countries, including Norway and the Netherlands. The electrification of transport constitutes a considerable additional load for the electricity grid. Electric mobility is estimated to increase the total demand for electricity by 15 to 20%. Given that charging profile of electric vehicles (EVs) tends to overlap with household consumption profiles, the power consumption peaks are likely to significantly increase as a result of EV charging, and limits to grid capacity may be reached [1].
Since May 2019, an experiment known as “Flexpower” has been underway in Amsterdam, with the aim of investigating the technical feasibility and measuring the impact of load shifting on public charging stations under real-world conditions. The project is a collaboration between the Municipality of Amsterdam together with the Amsterdam University of Applied Sciences, charging point operator Vattenfall, grid operator Liander, and knowledge centre ElaadNL.
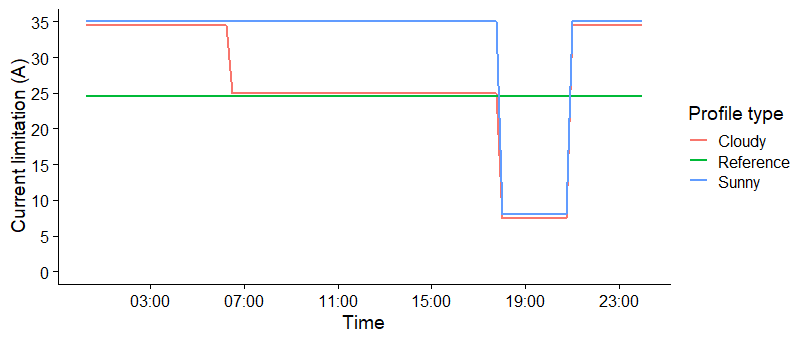
Out of the 2,100 public charging stations in the city, 450 were selected to deploy a time-dependent current limit, with a higher limit during sunny conditions and greater restrictions during cloudy conditions and household peak-use times (Figure 1). During this pilot, data was collected from about 40,000 users, responsible for approximately 450,000 unique charging transactions. The data contained information on the start time, end time, amount of energy, charge point, payment ID as well as smart meter information at 15-minute intervals. The dataset contains transactions of battery electric vehicles (BEVs; all-electric vehicle), as well as plug-in hybrid electric vehicles (PHEVs; cars with dual fuel systems) since these share the same public charging infrastructure. The type of EV is not known in the data, but a classification is inferred based on the charging behavior over multiple sessions of a payment ID.

Figure 1: The time-dependent current profile deployed on the selected Flexpower charging stations under sunny and cloudy conditions compared to the current limit on a regular public charging station in Amsterdam.
During the operational pilot, multiple key performance indicators (KPIs) were monitored to evaluate the effects of the smart charging profiles. These KPIs represent the interest of the different stakeholders involved in EV charging:
1. Effective charging power (kW) as a function of time of day,
2. Average amount of charged energy (kWh) per charging socket as a function of time of day,
3. Number of positively/negatively affected sessions in terms of amount of charged energy per transaction.
Results
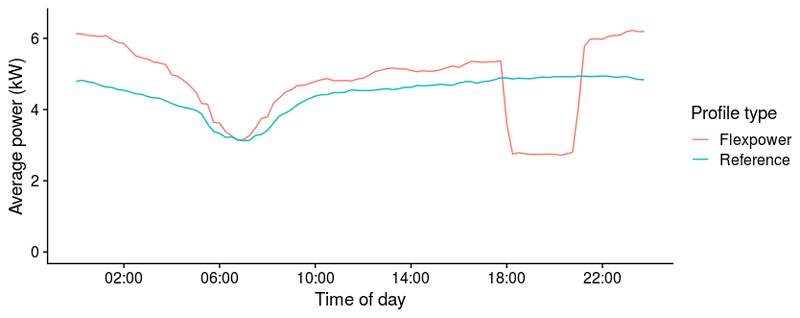
Figure 2 shows the average power of all active sessions over the course of the day. The charging power on Flexpower stations is higher during the daytime and lower during peak times, which is exactly the intended effect for grid balancing in relation to household energy usage and availability of solar energy.

Figure 2: Charging power averaged over all active sessions as a function of the time of day,. The resolution of the graph is 15 minutes, which is limited by the resolution of the data.
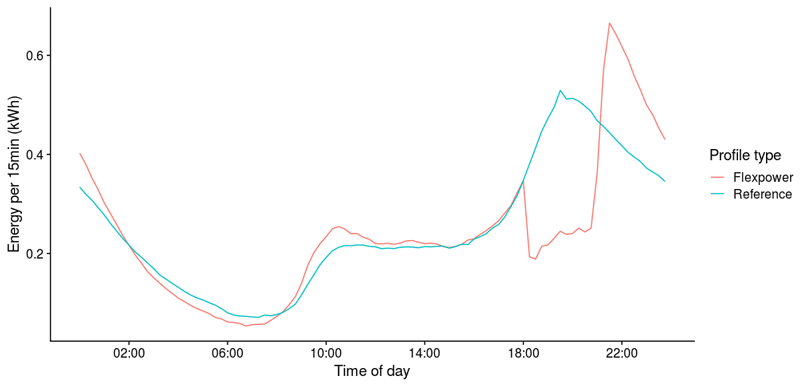
However, the charging volumes shown in Figure 3 (amount of charged energy) show no significant increase during the daytime, and a delayed peak in charging volume just after the evening peak. This shows that during the day the energy demand does not increase along with the higher power. Vehicles can charge faster but will finish the session earlier with the same net amount of charged energy. Without extra incentives to increase daytime demand, the current time-dependent profile does not result in more solar energy being utilised by EVs. The fact that there is a rebound peak directly after limitations are lifted proves that the Flexpower infrastructure can deliver higher energy volumes if there is outstanding demand.

Figure 3: Average energy volume per charging socket per 15-minute interval. During each 15-minute interval of the day, a share of charging stations is distributing energy while the remaining stations are idle. The value plotted in this figure is the total amount of energy charged during this 15-minute interval divided by the total number of stations and averaged over the duration of the experiment.
An important finding of this study is that a determining factor of the effects of a flexible charging profile are the charging characteristics of the EV itself. There are many different EV models on the market with different charging characteristics. The number of phases that a vehicle uses to charge can differ (there are 1-phase, 2-phase and 3-phase models) as well as the maximum current at which the vehicle can charge (16A, 25A and 32A). Full electric cars tend to have larger batteries that require higher charging powers (3-phase charging at up to 32A), PHEVs generally use 1-phase charging at 16A. The effects of a flexible current limit depend heavily on the type of EV that is charging.
In total, 5% of all transactions on Flexpower stations received a lower average power than on reference stations, which represents a negative impact on EV users. It should be noted, however, that PHEVs dominated these negatively affected sessions. As such, although there will be a slight reduction in zero-emissions kilometres driven by these users, it is unlikely that they will be impacted by range anxiety.
In total, 4% of the sessions were positively affected, owing largely to vehicles that were technically able to profit from higher current during off-peak hours. This category of vehicles is dominated by full electric vehicles, which are more dependent on a full charge. For this category, the Flexpower profile provides a significant improvement.
The results of this experiment show that smart profiles on charging stations can suppress charging volumes during a designated time window without large implications for EV drivers. The possibility of increasing charging volumes during the day is limited by the level of demand and technical limitations of most EVs currently on the market. More advanced battery electric vehicles are increasing in popularity in the major European markets for EVs, so the percentage of positively affected users is likely to increase rapidly in the near future.
Link:
[L1] https://www.seev4-city.eu/projects/amsterdam/
Reference:
[1] García-Villalobos, Javier, et al.: “Plug-in electric vehicles in electric distribution networks: A review of smart charging approaches”, Renewable and Sustainable Energy Reviews 38 (2014): 717-731.
Please contact:
Pieter Bons, Amsterdam University of Applied Science, The Netherlands
Nanda Piersma,
Amsterdam University of Applied Science and CWI, The Netherlands


