







by Thorsten Dickhaus (University of Bremen), Francesca Giuffrida (Leiden University and IMT School for Advanced Studies Lucca) and Yonqqi Wang (CWI)
We present powerful and easy-to-compute e-values for the classical statistical task of testing associations between two binary traits based on contingency table data. Genetic case-control association studies are our main intended use case.
Testing for association between two categorical variables on the basis of contingency table data is a classical task in inferential statistics. One prominent example is the “Lady tasting tea” experiment described by Sir R. A. Fisher in 1935. Analysing many contingency tables simultaneously and/or sequentially is important in the context of genetic association studies when analysing associations between categorical genetic markers and a categorical (often binary) disease status; see, e.g., [2].
The research question we address [1] is how to design an e-value for a contingency table, that is both easy to compute and powerful. In this, we mean by “easy to compute” that resource-intensive operations like a loop over all contingency tables with given marginal counts shall be avoided. This requirement refers to the situation that hundreds of thousands of such e-values have to be computed for one and the same dataset in the case of a genome-wide association study (GWAS). By “powerful”, we mean that the e-value should (with high probability) be larger than the “baseline” e-value obtained by calibrating the p-value based on Fisher’s exact test to the e-value scale using a standard p-to-e-calibrator. Since the null hypothesis of no association is composite, the Bayes factors proposed in [3] are prone to lack the e-value property.
Our primarily intended use case is a GWAS which is either multi-centric (independent patient groups are recruited at different locations) or group-sequential (independent patient groups are recruited at the same location at different time points). These two sampling schemes are realistic for GWAS, and e-values (if easy to compute and powerful) and their corresponding e-processes can allow data analysts to combine the evidence across centres or across time points, respectively, in a convenient and flexible manner (e.g., by multiplication or by averaging of e-values). In particular, e-processes allow for safe anytime-valid inference, implying the possibility of optional stopping.
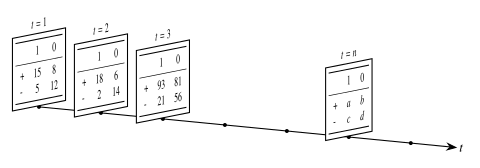
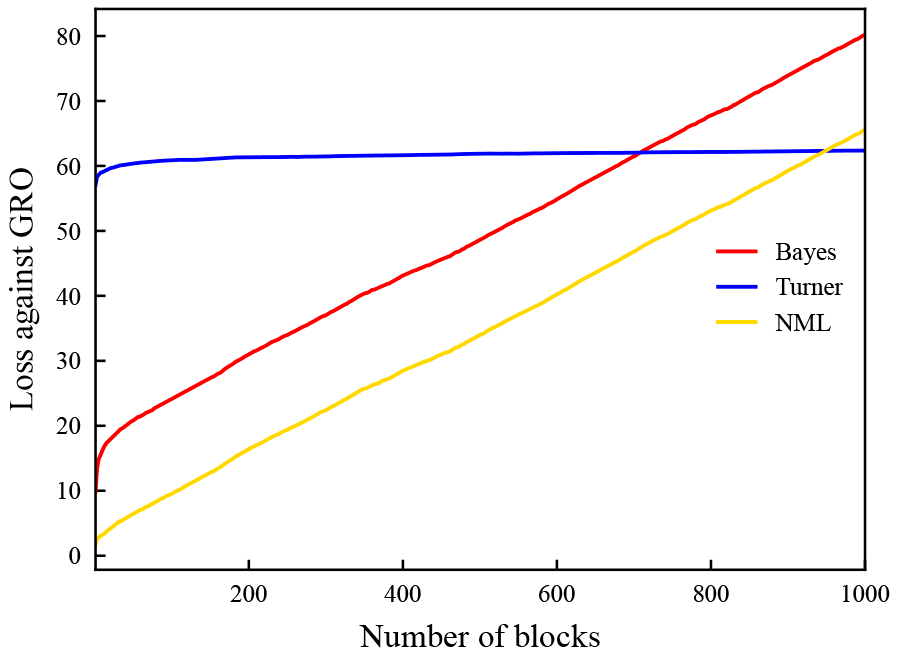
For the special case of a 2 × 2 contingency table, we have investigated several possibilities to define such e-values, and we were able to characterize sampling schemes under which the usage of each of these e-values is particularly appropriate: while the e-process that was recently introduced by Turner et al. [4] has theoretical growth-optimality (under the alternative hypothesis of association) properties for paired data sequences, we have found that, when given a single large contingency table (the “batch setting”), it does not perform well - and another standard e-process, based on the principle of universal inference, performs even worse. In contrast, conditional types of e-variables tend to perform better in the batch setting, and among these, uniformly-most-powerful (conditional) e-variables perform best. When batches (i.e., tables) arrive sequentially, as illustrated in Figure 1, the picture becomes more complicated: Turner et al.’s e-variable is generally optimal asymptotically, and a conditional type of e-variable is often, but not always, preferable at smaller sample sizes.
This theoretical finding is confirmed empirically by means of computer simulations (as illustrated by Figure 2) and by re-analysing real genetic association datasets. Furthermore, we have revisited a meta-analysis replicating published psychological findings with peer-reviewed experimental protocols.
While our findings allow for analysing associations between a binary disease status and a binary genetic marker (e.g., a risk allele), future research will extend these investigations to categorical genetic markers with more than two categories. In particular, bi-allelic single nucleotide polymorphisms (SNPs) are often considered in GWAS. Such SNPs exhibit three categories.
References:
[1] S. Arnold, et al., “E-Values for contingency tables, Revisited” [work in preparation; an initial presentation is given at the 2026 SAVI meeting at University of Twente], 2026.
[2] T. Dickhaus, et al., “How to analyze many contingency tables simultaneously in genetic association studies,”
Statistical Applications in Genetics and Molecular Biology, vol. 11, no. 4, Art. no. 12, 2012. https://doi.org/10.1515/1544-6115.1776
[3] T. Dickhaus, “Simultaneous Bayesian analysis of contingency tables in genetic association studies,” Statistical Applications in Genetics and Molecular Biology, vol. 14, no. 4, pp. 347–360, 2015. https://doi.org/10.1515/sagmb-2014-0052
[4] R. J. Turner, et al., “Generic E-variables for exact sequential k-sample tests that allow for optional stopping,”
Journal of Statistical Planning and Inference, vol. 230, Art. no. 106116, 2024. https://doi.org/10.1016/j.jspi.2023.106116
Please contact:
Thorsten Dickhaus
University of Bremen, Germany