


by Yongxi Long and Erik van Zwet (Leiden University Medical Centre)
Anytime valid testing with e-values offers great flexibility allowing both optional stopping (peeking) and optional continuation (collecting more data). The price to pay is a reduction of statistical power. Using data from more than 20,000 randomized trials, we evaluate how e-values compare with classical p-values in balancing flexibility and efficiency.
Clinical trials are conventionally conducted under a fixed sample design, in which the sample size is pre-determined and the analysis is performed only after data collection has ended. In practice, however, investigators often want greater flexibility. They may wish to monitor the accumulating evidence, and stop if the treatment benefit is evident or recruitment proves difficult. They may also want to collect more data if the results are promising but not yet conclusive (optional continuation). E-values [1] offer a unified framework of anytime-valid inference to achieve such flexibility; they remain valid no matter how frequently the data is inspected or how the sampling plan changes. However, this flexibility comes at the price of reduced power. We conducted a large-scale empirical study to assess the trade-off.
What are e-values?
Statistical tests are designed to limit the probability of a false positive result at a predefined significance level α. Classical p-value procedures exhaust their “α budget” at the final analysis. Therefore, they are incompatible with optional continuation and require rigorous α-spending rules [2] to enable optional stopping.
E-values provide a more flexible alternative. They are designed so that, when there is truly no treatment effect (the null hypothesis), they are small (not greater than 1) on average. Large e-values therefore represent evidence against no effect. E-values can be used to build e-processes: these are sequences of e-values computed from accumulating trial data such that, under the null hypothesis, the probability that they will ever exceed a fixed threshold remains small. We can use an e-process to monitor the trial, and reject the null hypothesis whenever the e-process exceeds a certain threshold. As such, an e-process spends the α budget continuously. The user must decide if they want to spend α cautiously or more boldly.
Empirical evaluation
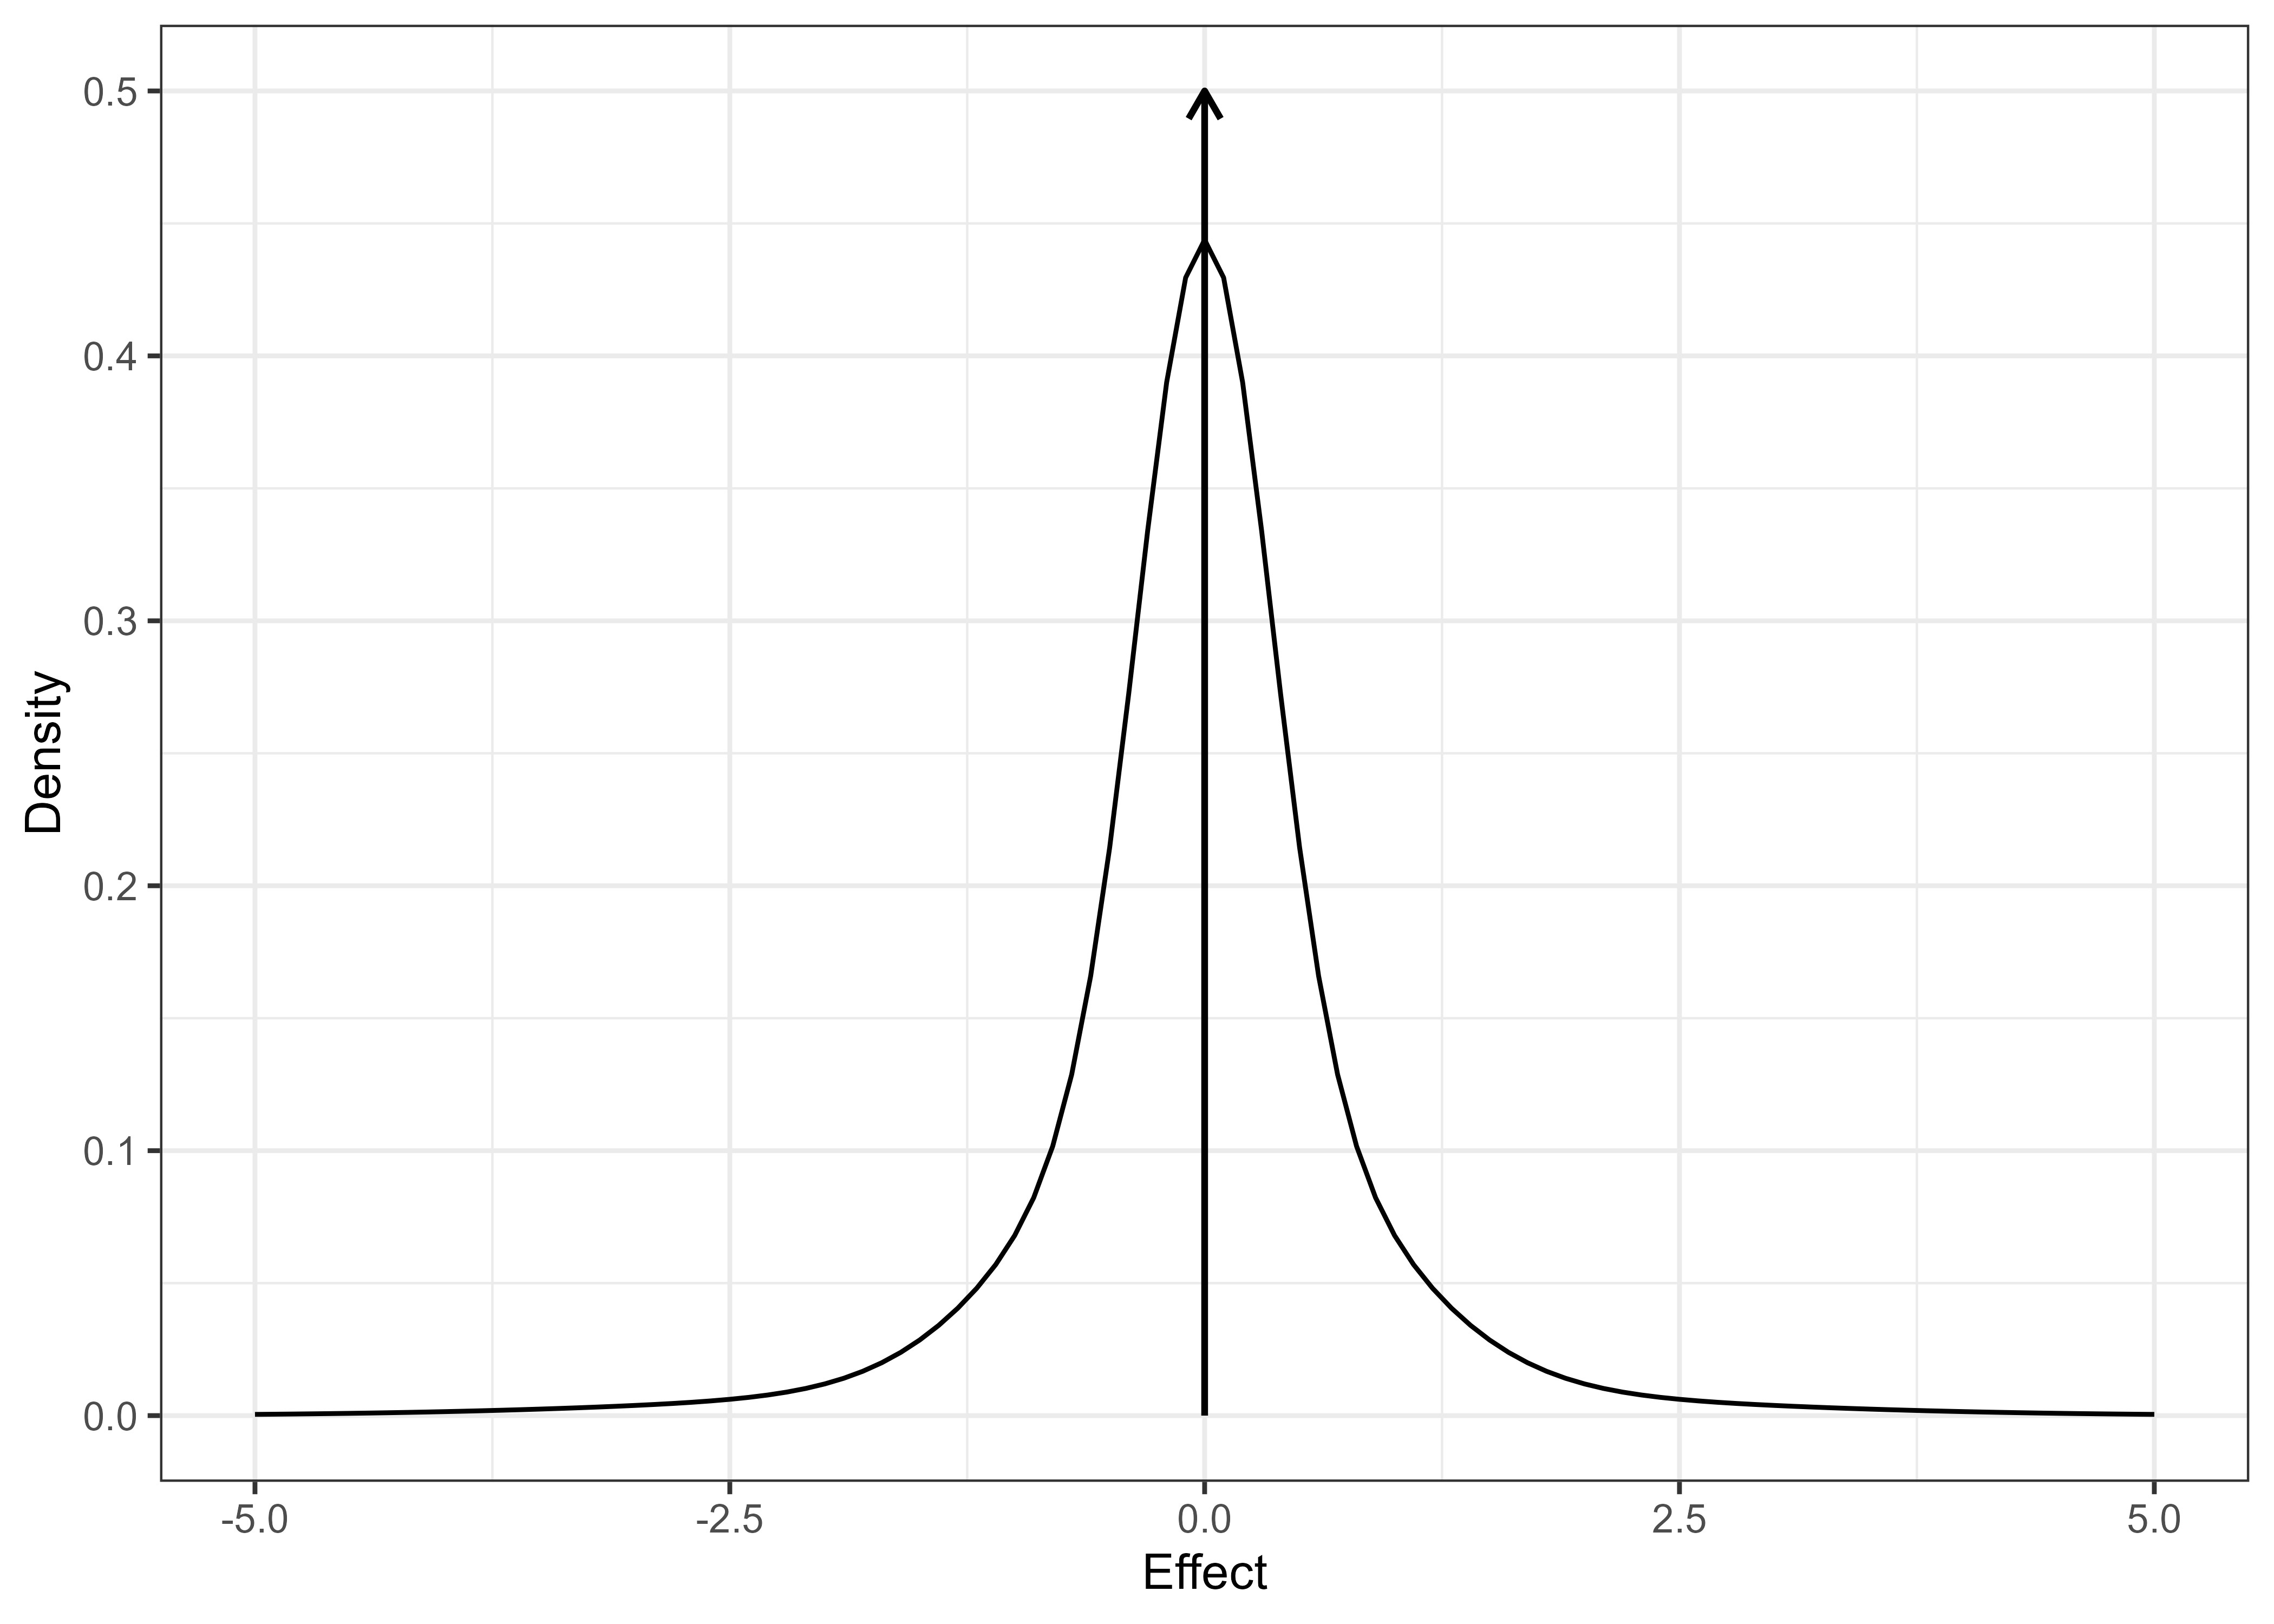
To answer the question of what happens if trialists had used e-values instead of p-values in clinical trials, we used a large collection of 20,000+ real-world trials from the Cochrane Database of Systematic Reviews (CDSR). We start by estimating the distribution of effect sizes. We find a spike around zero indicating many very small effects and a long tail of larger effects (Figure 1). We then generated synthetic trial trajectories up to and beyond their original sample sizes, which match the observed summary statistics (effect estimate and standard error) of the original trial at the original sample size. We can use this synthetic dataset to benchmark any given e-process against the fixed sample p-value. We focus on the probability of reaching statistical significance (probability of significance or PoS) and the time until rejection.
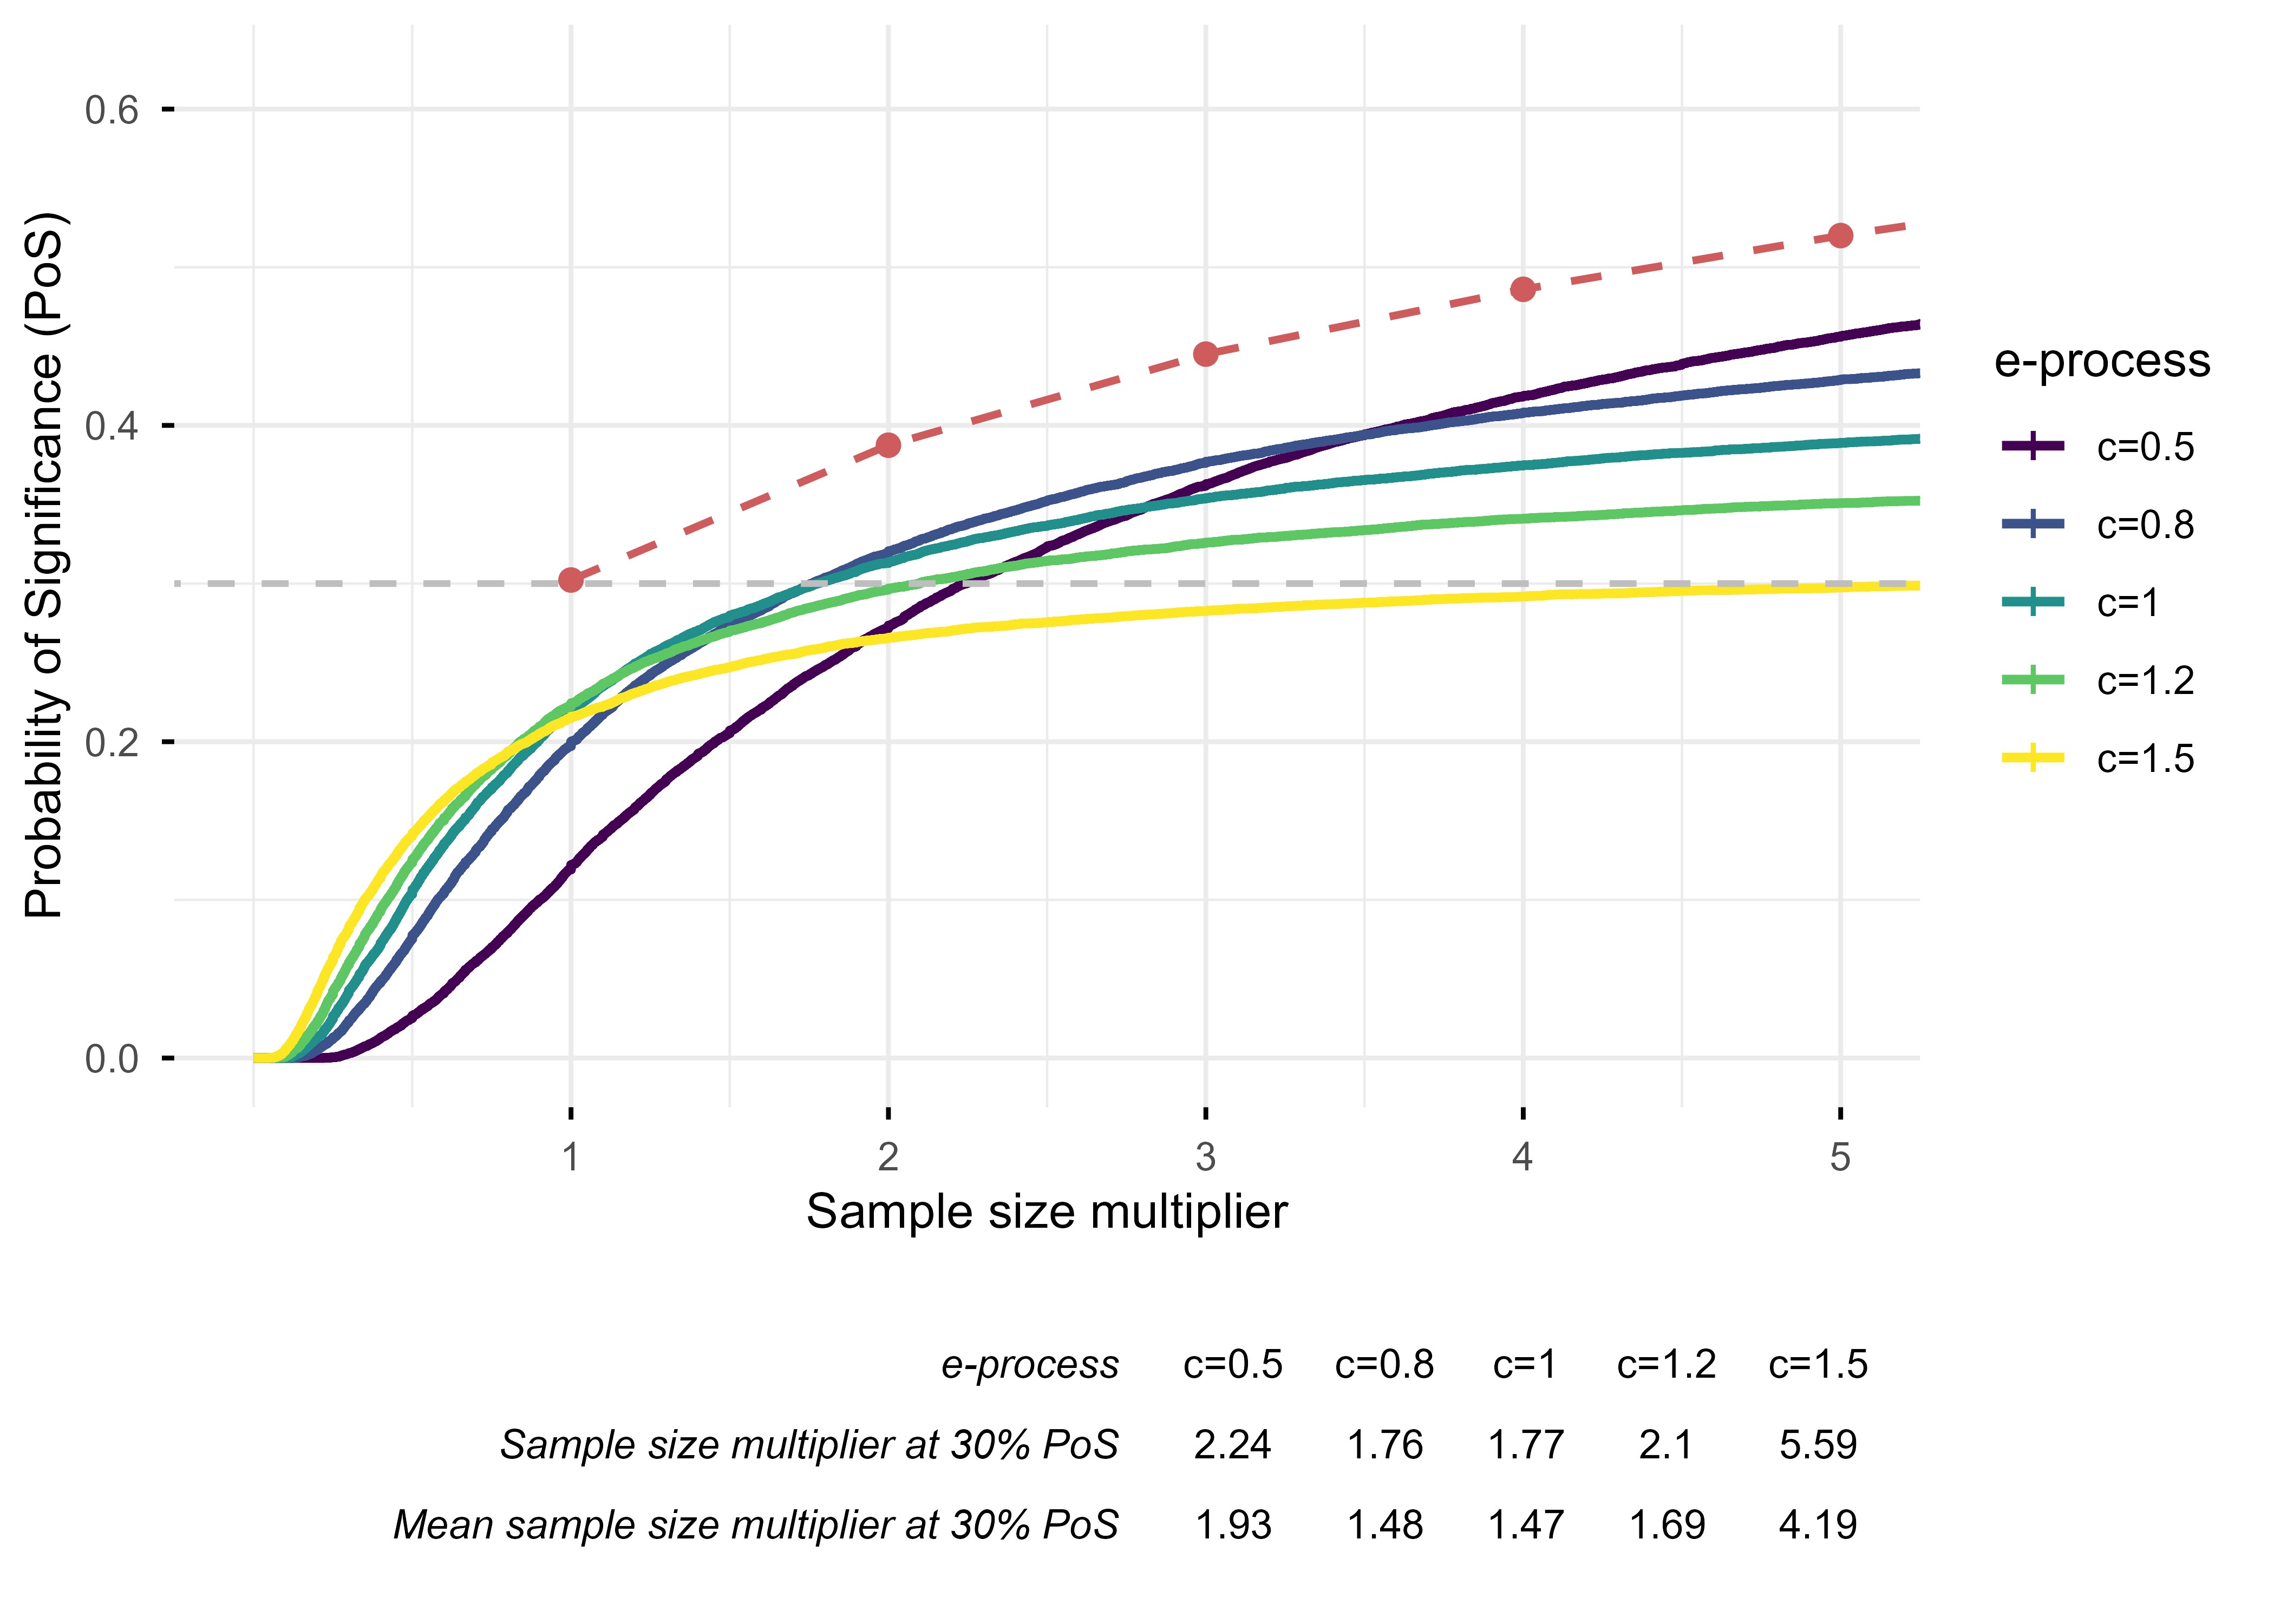
Various e-process constructions can be considered for the CDSR cohort which differ in the rate at which they spend their α budget. For every trial, we can infer the minimum clinically important difference (MCID) that was used for its sample size calculation. We construct e-processes as sequences of likelihood ratios comparing c × MCID to the null for several choices of c. Choosing a large value of c implies that we expect that the true effect is large and we should spend α quickly to detect it as soon as possible. Small values of c mean that we anticipate a small effect, and we should reserve enough α until we have collected a large sample.
Flexibility always costs power, but the cost can be reduced by designs
The PoS of fixed-sample p-value testing when every CDSR trial is continued until 1,2,…,5 times its original sample size is plotted in red dashed line as a reference in Figure 2. The PoS of likelihood ratio e-processes with different target effect sizes are plotted cumulatively against sample size multipliers. We find that targeting the e-process at the MCID (i.e., c=1) performs well across the CDSR cohort. It requires planning for approximately 1.8 times the original sample size to match the PoS of a fixed-sample p-value, but the expected sample size is reduced to approximately 1.5 times due to optional stopping: there are many cases when the e-process reaches significance long before the planned sample size.
Conclusion
The great flexibility of e-values offers attractive advantages, particularly in enabling anytime-valid testing. Their practical implementation in clinical trials requires a delicate balance between flexibility and power. If we spend our α-budget too fast, we make suboptimal use of the available sample size. On the other hand, if we are too cautious, we are effectively reserving α for finding small effects at sample sizes that are too large to be realistic given the practical and financial constraints of clinical trials. In a setting such as the CDSR which is characterized by many small effects and a few large ones, relatively aggressive e-process constructions yield good average efficiency.
References:
[1] Grünwald, P., de Heide, R., & Koolen, W. (2024). Safe testing. Journal of the Royal Statistical Society Series B:
Statistical Methodology, 86 (5), 1091–1128. https://doi.org/10.1093/jrsssb/qkae011
[2] Cook, T. D. (2002). P-value adjustment in sequential clinical trials. Biometrics, 58 (4), 1005-1011.
Please contact:
Yongxi Long
Leiden University Medical Centre, The Netherlands
Erik van Zwet
Leiden University Medical Centre, The Netherlands

