


by Serena Berretta (University of Genova), Daniela Cabiddu (CNR-Imati), Michela Mortara (CNR-Imati) and Michela Spagnuolo (CNR-Imati)
Remote sensing provides almost global spatial coverage, but with limits in resolution and accuracy. Ground stations, conversely, provide very accurate coverage with high temporal resolution, but sparse and pointwise. What’s missing from this picture is accurate local knowledge with a high spatial resolution, making it possible to understand and analyse local phenomena to their full spatial extent. To fill the gap, we propose a paradigm shift in field sampling; environmental surveys that are dramatically cheaper, quicker and easier to perform, and the ability to perform visualisation and analysis tasks as the survey progresses. This is made possible by a real-time adaptive sampling method, embedded within a mobile observation platform. The method continuously guides and refines samples acquisition while in the field, elaborating the variable distribution and its related uncertainty along with the sampling process.
Environmental monitoring is crucial for investigating the condition of soil, air and water, describing natural phenomena, and promptly reacting to, and even preventing, accidents. In standard environmental surveys, the sampling locations are predetermined either on a regular grid or are defined by a-priori knowledge. Once collected, samples are subject to laboratory analysis to provide accurate measurements at sample locations and generate geo-statistical maps to represent an estimation of the continuous distribution of the environmental variables over the domain. Further surveys might then be required on sub-areas of the global domain to reach the desired reliability. Apart from the cost of sampling, the time required for laboratory analysis might preclude a prompt reaction during a critical event.
New technology enables more efficient approaches to sampling: new, accurate dynamic positioning systems coupled with lighter and cheaper sensors can be used as mobile laboratories, which in the near future will yield an explosion of georeferenced, highly accurate in-situ data. This opens the door to on-the-fly sampling decisions – quite the opposite to traditional approaches based on predefined locations.
These new methods require innovative computational solutions to make data analysis precise and fast. To this end, we propose a new sampling methodology, adaptive sampling, based on a fast and effective iterative refinement of geo-statistical maps estimating the distribution of acquired environmental variables. In our setting, environmental variables are measured by sensors mounted on mobile platforms, and the data acquisition step is interleaved with the computation of the distribution map, which is iteratively refined. The concept of uncertainty of the estimation plays a key role in the refinement process and switches from a “passive” role in traditional sampling, where it was used retrospectively to measure the accuracy of the final model, to an “active” role, by intervening in the definition of “smart” sampling locations. The new sampling site is located where we are less confident in our prediction, i.e., in locations of maximum uncertainty.
To make this happen we need three main ingredients: (i) the geometric representation of the spatial domain of the environmental variables; (ii) physical samples acquired by modern accurate sensors; (iii) geo-statistical and computational tools to analyse and correlate data, and to estimate values in unknown locations and their relative uncertainty.
To make our adaptive sampling work, the digital geometric representation of the survey area is built as a volumetric model, a structured grid of voxel/cells of equal size, while the acquired raw data undergo filtering, synchronisation and interpolation as pre-processing before entering the reconstruction cycle. Then, the prediction and the uncertainty maps are computed on the volumetric grid, which results in the predicted variable distribution map and a new suggested sampling position. The computation of the prediction and uncertainty maps is performed at each iteration, that is, every time a waypoint is reached. All acquired samples contribute to identify the covariance law among data, that is, intuitively, how similar we expect two measures to be based on their spatial distance. This covariance law, expressed by the function variogram [1], allows us to predict values in unsampled locations by running several Gaussian Simulations [1] and by assigning both an estimated value (the mean of the simulation outputs) and an uncertainty value (the variance of the simulation outputs) to each cell.
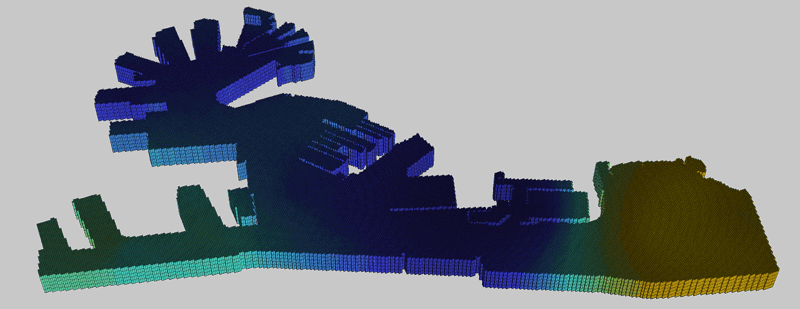
Figure 1: A geometric representation of the harbour in Genoa (Italy). It represents the water volume within the pier structures and the seabed. The 3D model is a structured grid of voxels of equal size and it is generated starting from bathymetric data and known boundaries of the piers. The different colours show an example distribution of an environmental variable associated to grid cells.
As a first case study, we are focussing on water monitoring in the harbours of Genova (Italy) (Figure 1) and Toulon (France). Anyway, the system has the potential to be included in the monitoring practices of other harbours and additional case studies are currently under definition. Preliminary results [2] show that our adaptive sampling can reach the same estimated accuracy as traditional approaches do, but with fewer samples. We believe that this approach can therefore facilitate faster, cheaper, highly efficient monitoring systems, ideal for providing real-time environmental variable estimates in emergency scenarios. Mobile sensor platforms allow users to bypass laboratory analysis, making the survey more affordable, thus enabling a higher sampling frequency.
Future work will focus on unstructured grid representation of the water volume to better align with the complex boundaries of the piers (e.g. using tetrahedral cells). Since cells will have uneven volumes, a proper change of support strategy must be planned first; this is an open problem in mathematical research that we are currently studying. Finally, by changing the robotic platform (e.g. to drones), the approach is easily transferable to the environmental monitoring of soil and air.
This work was conducted within the framework of the European project “Real-time Adaptive Monitoring with Automation of Sampling - Port Coastal Areas - MATRAC-ACP”, funded by the Interreg Italy-France Maritime 2014-2020 Program - Axis priority 2, Specific objective 6C2 “To increase protection of marine waters in ports”.
Link:
[L1] http://interreg-maritime.eu/web/matracacp
References:
[1] Chiles, J. P., & Delfiner, P. (2012). Geostatistics: Modeling Spatial Uncertainty. 2-nd ed.-NewYork, Toronto, JohnWiley'Sons.
[2] Berretta, S., Cabiddu, D., Pittaluga, S., Mortara, M., Spagnuolo, M., & Zuccolini, M. V. (2018). Adaptive Environmental Sampling: The Interplay Between Geostatistics and Geometry. In STAG (pp. 133-140).
Please contact:
Serena Berretta
University of Genova, Italy

