


by Michael Levi
Estimates of cybercrime costs are highly contested. We have become conditioned to believe that in order to generate control expenditure and powers to override privacy, very high attention-grabbing figures are needed. We were asked by the UK Ministry of Defence in 2011 to do a relatively ‘quick and dirty’ calculation to stimulate some serious analysis to counterbalance some of the high guesstimates currently in circulation, which have little general credibility. This attempt to dissect plausible data from scattered guesstimates was led by Ross Anderson from Cambridge and was co-authored by Chris Barton, Rainer Böhme, Richard Clayton, Michel van Eeten, Michael Levi, Tyler Moore, and Stefan Savage [1].
No study of the costs of cybercrime can be definitive. The spectrum is between a narrow summation of the known direct costs of detected crimes (perhaps even restricted to cases where a conviction has been obtained, because only then is criminality definitive), at one end, and speculative extrapolations from cases or sub-sets the dimensions of whose sets are unknown, at the other. In cyber, this is particularly complicated because it is a set of diverse acts representing mechanisms of crime commission, about which few organisations - whether victims or third parties like the police or vendors - compile data comprehensively or systematically. And unlike fraud, the costs of which one of us had reviewed previously [2], relatively little systematic effort had gone into measuring the costs of any sub-component of ‘the cyber problem’. For each of the main categories of cybercrime we set out what is and is not known of the direct costs, indirect costs and defence costs – both to the UK and to the world as a whole, since the attribution of costs to particular countries is especially difficult in cyber. With global estimates, some fairly crude scaling based on GDP or in some cases, volumes of internet trade, have to be done to estimate costs to particular countries. Since the means (e. g., botnets) would not be around if there were not ends (e. g., phishing victims), we consider losses caused by the cybercriminal infrastructure as indirect by nature; irrespective of whether or not the legal framework formally criminalizes the means. We were more cautious than many others about the costs of IP espionage, since so little is known about both losses and whether external cyber-attacks or (as we suspect) internal corruption are the primary cause of those we do know about.
We distinguish carefully between traditional crimes that are now ‘cyber’ because they are conducted online (such as tax and welfare fraud); transitional crimes whose modus operandi has changed substantially as a result of the move online (such as credit card fraud); new crimes that owe their existence to the Internet; and what we might call platform crimes such as the provision of botnets which facilitate other crimes rather than being used to extract money from victims directly.
As far as direct costs are concerned, we find that traditional offences such as tax and welfare fraud cost the typical citizen in the low hundreds of pounds/Euros/dollars a year; transitional frauds cost a few pounds/Euros/dollars; while the new computer crimes cost in the tens of pence/cents. In some cases, low production and distribution costs to criminals mean that direct social losses are roughly similar to criminal profits. For instance, UK consumers provided roughly $400,000 to the top counterfeit pharmaceutical programs in 2010 and perhaps as much as $1.2M per-month overall. UK-originated criminal revenue is no more than $14m a year, and global revenue, $288m. The five top software counterfeiting organisations have an annual turnover of around $22m worldwide. However, the indirect costs and defence costs are much higher for transitional and new crimes. For the former they may be roughly comparable to what the criminals earn, while for the latter they may be an order of magnitude more. As a striking example, the botnet behind a third of the spam sent in 2010 earned its owners around US$2.7m, while worldwide expenditures on spam prevention probably exceeded a billion dollars. Such defence expenditure is not necessarily irrational, but where crime is concentrated among a relatively small number of offenders, it makes sense to use criminal justice mechanisms to incapacitate the offenders. For example, the number of phishing websites, of distinct attackers and of different types of malware is persistently over-reported, leading some police forces to believe that the problem is too large and diffuse for them to tackle, when in fact a small number of gangs lie behind many incidents and a police response against them could be far more effective than telling the public to fit anti-phishing toolbars or to purchase antivirus software (though this might also be desirable). This is part of a much wider problem of attributing risks to patterns of offending. The legal-political problem is often how to take criminal justice action when suspects have been identified in a jurisdiction beyond ready reach! [3] Victimisation survey data suggest that cybercrime is now the typical volume property crime in the UK, and responses to it need to be mainstreamed. We do not claim that our analysis of the costs is more than a solid beginning in hotly disputed areas of which much is terra incognita. It is up to others to build upon these foundations: like the work of early cartographers, we may find that our map requires a lot more survey work.
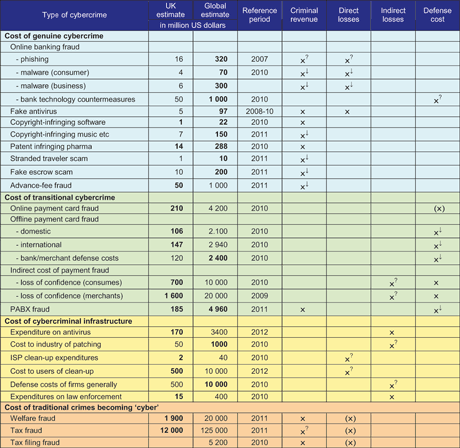
Table 1: Judgement on coverage of cost categories by known estimates.
Estimating costs and scaling: Figures in boldface are estimates based on data or assumption for the reference area. Unless both figures in a row are bold, the non-boldface figure has been scaled using the UK’s share of world GDP unless otherwise stated in the main text. Extrapolations from UK numbers to the global scale should be interpreted with utmost caution. A threshold to enter this table is defined at $10m for the global estimate.
Legend: × : included, (×) : partly covered; with qualifiers ×↑ for likely over-estimated,
×↓ for likely underestimated, and ×? for high uncertainty.
Links/References:
[1] Measuring the Cost of Cybercrime http://weis2012.econinfosec.org/papers/Anderson_WEIS2012.pdf
[2] The Nature, Extent and Economic Impact of Fraud in the UK. London: Association of Chief Police Officers. M. Levi, J. Burrows, M. Fleming, and M. Hopkins. (with the assistance of M. Matthews). http://www.cardiff.ac.uk/socsi/resources/ACPO%20final%20nature%20extent%20and%20economic%20impact%20of%20fraud.pdf
[3] UK public and private sector expectations are explored further in M. Levi and M. Williams (forthcoming) eCrime Reduction Partnership Mapping Study, funded by Nominet Trust.
Please contact:
Michael Levi
Cardiff School of Social Sciences, Wales, UK
E-mail:
