


Alexander Serebrenik, Mark van den Brand and Bogdan Vasilescu
Understanding software maintainability often involves calculation of metric values at a micro-level of methods and classes. Building on these micro-level measurements and complementary to them, econometric techniques help to provide a more precise understanding of the maintainability of software systems in general.
Maintaining a software system is like renovating a house: it usually takes longer and costs more than planned. Like a house owner preparing a condition report identifying potential problems before renovation, a software owner should assess maintainability of software before renovating or extending it. To measure software maintainability one often applies software metrics, associating software artifacts with numerical values. Unfortunately, advanced software metrics are commonly measured at a level of small artifacts, eg methods and classes, and fail to provide an adequate picture of the system maintainability. Continuing the analogy, the state-of-the-art in software metrics corresponds to a condition report detailing the state of every brick and obscuring the general assessment in the multitude of details. Metrics visualization techniques provide a general overview of the measurements but have difficulties with presenting evolution of these measurements in time.
To see the forest of a software system for the trees of individual measurements, aggregation techniques are used. Current aggregation techniques are, however, usually unreliable or involve human judgment. For instance, the mean is known to become unreliable in the presence of highly skewed distributions, which are typical for software metrics. Another approach, distribution fitting, consists of manually selecting a known family of distributions and fitting its parameters to approximate the observed metric values. The fitted parameters can then be seen as the aggregation results. However, the fitting process should be repeated with each new metric considered. Moreover, it is still a matter of controversy whether, for instance, software size is distributed log-normally or double Pareto. Finally, threshold-based approaches assume the availability of a set of metric thresholds: depending on which thresholds the metric value of an individual element (eg method or class) exceeds, the value is classified as being poor, mediocre or good. If this is the case, the entire system is labelled as being poor, mediocre or good depending on the percentage of poor, mediocre and good values. By definition, threshold-based approaches require the presence of either commonly accepted thresholds or a large benchmark collection to derive such thresholds. Unfortunately, neither the public thresholds nor the composition of the benchmark collections are commonly accepted or can be scientifically validated. Furthermore, the threshold approaches assume that if all individual values are good, then so is the quality of the entire system. This, however, is not the case for such metrics as the depth of inheritance tree.
In an on-going project that commenced in 2010 a research team from Eindhoven University of Technology, The Netherlands (Alexander Serebrenik, Mark van den Brand and Bogdan Vasilescu) is investigating application of econometric inequality indices as aggregation techniques. Inequality indices are econometric techniques designed to measure and explain inequality of income or welfare distributions. Their application to aggregation of software metrics is based on the observation that numerous countries have few rich and many poor, and similarly, numerous software systems have few very big or complex components and many small or simple ones. Inequality indices combine the advantages of the preceding aggregation techniques and avoid their disadvantages. Similarly to distribution fitting, they provide reliable results for highly-skewed distributions. Similarly to the mean they do not require complex application procedures. Moreover, application of inequality indices does not require the availability of well-established thresholds or extensive benchmarking.
In 2010 we advocated the use of the Theil index, one of the econometric inequality indices, to measure and explain inequality among software metric values. We observed that inequality in file sizes of the Linux Debian distribution lenny can be better explained by the package these files belong to, rather than the implementation language. This suggests that if one would like to reduce this inequality, ie distribute functionality across the units in a more egalitarian way, one should focus on establishing cross-package size guidelines. In 2011 we conducted an extensive empirical comparison of different inequality indices and determined guidelines when different inequality indices should be used for software metrics aggregation. In another recent work we have applied inequality indices to studying the impact of different software project attributes on the development effort. We found that such project attributes as the primary programming language, the organization type, and the year of the project have a higher impact than the development platform or the intended market.
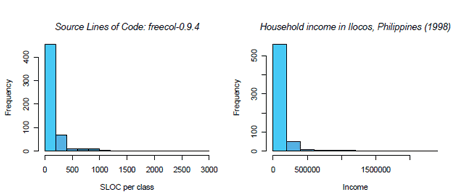
Figure 1: Software metrics (SLOC) and econometric variables (household income in the Ilocos region, the Philippines) have distribution with similar shapes.
Our current research, carried out in cooperation with Inria, Université de Bordeaux and University of Paris 8 (France), compares inequality indices with a threshold-based technique called Squale. We have found a close theoretical relationship between the two, and we have further conducted an empirical evaluation of the approaches proposed. Even more recently, together with the colleagues from Software Engineering Lab of University of Mons (Belgium), we have been investigating the application of inequality indices to studying developer specialization in open-source projects.
As the most important direction of the future work we consider integration of the inequality indices proposed in predictive models. We believe that the ability of inequality indices to explain inequality of the metric values observed will provide for more precise prediction of the metric values.
Please contact:
Alexander Serebrenik
Eindhoven University of Technology, Eindhoven, The Netherlands
Tel: +31402473595
E-mail: