


by Christophe Joubert, Vicente Monrabal, Miguel Montesinos and Carlos Sánchez
In April 2006, in its Directive 2006/32/EC on energy end-use efficiency and energy services, the European Parliament and Council encouraged the installation of smart meters at every end-user in Europe with a complete coverage planned for 2018. This power network evolution implies new needs such as real-time management of energy flows to increase connectivity, automation and coordination of producers, providers and consumers in the distribution network. Our work contributes to the attainment of this goal by providing real-time visualization of energy alarms detected at the end-user end, ie medium voltage (MV) / low voltage (LV) energy alarms.
In the ITEA2 international project IMPONET (AVANZA TSI-020400-2010-103, ITEA2 Nº 09030), a comprehensive, flexible and configurable information system has been developed to support the most complex and advanced requirements in energy management, in particular power quality monitoring and the remote control and smart metering platform. To date, power companies have been using geographical information systems (GIS) with historical data to visualize energy alarms, faults, and other energy information on a map [1]. This project offers novel power quality monitoring solutions for power companies to visualize real-time information coming from the medium voltage (MV) / low voltage (LV) distribution network.
In order to operate the network more efficiently, it is necessary to have a systematic and standardized method of exploiting data from a huge number of electronic devices involved in control and protection of power systems. One solution investigated in IMPONET is the use of the object management group (OMG) data distribution service (DDS) open standard for messaging that supports real-time systems [2]. Also, to achieve the ambitious goals that are envisioned for Smart Grids of the future, a new conception of network monitoring systems is required. Within the power quality monitoring force task, we developed a geoportal that allows the continuous monitoring of the network with real-time data processing capabilities. It includes features and services that enable providers to detect issues on the power network, to monitor their evolution and to make decisions based on this information.
The power quality monitoring geoportal is divided in four parts as described in Figure 1: layer tree, substation selector, map viewer, and business intelligence (B.I.) viewer. The layer tree contains a set of common and open base layers as well as several specific overlays: real-time faults, power network components, and B.I. layer for statistics. The map viewer allows a user to interact with any element of selected layers, and to show historical data or real-time events directly from the DDS. Finally, the map viewer interacts with the B.I. viewer, which allows a user to request any kind of statistics over the power quality OLAP cubes preprocessed from monitoring campaigns.
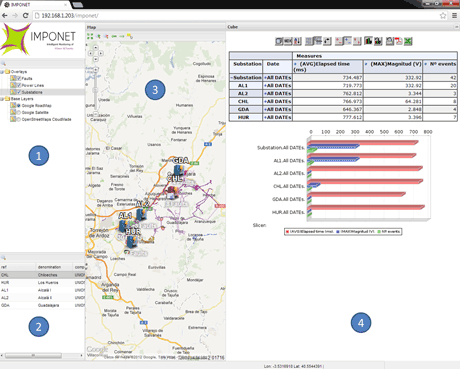
Figure 1: Geoportal for real-time and B.I. visualization of energy alarms
The novelty of our approach resides in the processing of real-time power fault events from DDS to GIS web clients in three stages, as illustrated in Figure 2:
1) When the fault overlay is selected, a DDS subscriber is internally launched and connected to the GIS client in order to capture fault events, ie voltage sags, swells and other power disturbances detected at the smart meters and substations.
2) Through a permanent link between the GIS application and the DDS subscriber, based on an atmosphere server for asynchronous web applications and Socket.IO for communication channels, fault events are transmitted in real-time to the GIS client. This technology allows any web client to interact with the service without needing to refresh the web client [3].
3) Fault events being geolocated, they are represented on the power network where faults occur (as indicated on Figure 3) as soon as they become available on the DDS. In the case of MV / LV faults, they appear close to the substations. Faults are depicted in different colours on a green to red scale in order to show the alarm severity based on duration and magnitude of the fault.
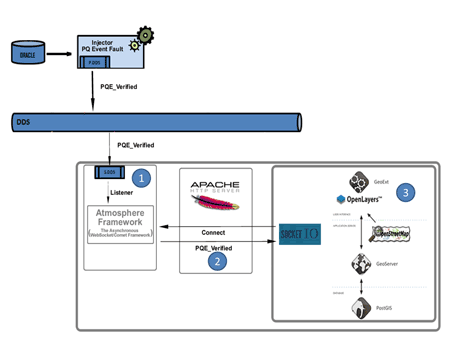
Figure 2: Real-time connection architecture between DDS and geoportal
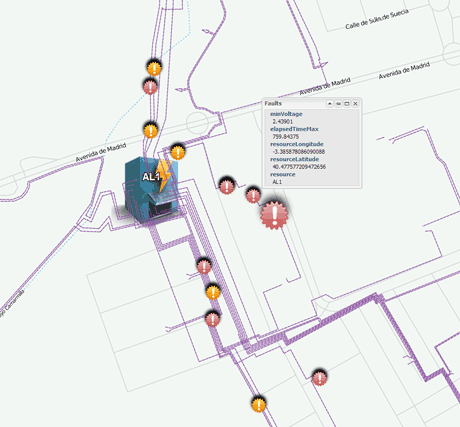
Figure 3: Real-time layer with geolocated fault events coming from DDS
The results are very encouraging: power companies have already shown an interest in such architecture, which provides features not yet covered by current power company solutions, in particular real-time geolocated information for the lower part of the power network, directly from the outputs of end-user smart meters.
Collaboration for this project spanned four countries (Korea, Republic of Slovenia, Spain and Turkey) and fifteen project partners: Answare, Deusto University, Tecnalia, INDRA, Innova, Kapion, Kema, LNL, UPM, Union Fenosa, Girona University, Ljubljana University, LDOS, Wooam. Our work is partially supported by the Spanish MEC INNCORPORA-PTQ 2011 program.
Link:
http://www.innovationenergy.org/imponet
References:
[1] G. Aydin: “Service oriented architecture for geographic information systems supporting real time data grids”, Ph.D. Thesis: Indiana University, 2007
[2] J. A. Dianes et al: “Using standards to integrate soft real-time components into dynamic distributed architectures”, Comp. Stand. & Interfaces, vol. 34, no. 2, pp. 238-262, 2012
[3] E. Bozdag et al: “Performance testing of data delivery techniques for AJAX applications,” J. of Web Eng., vol. 8, no. 4, pp. 287-315, 2009.
Please contact:
Christophe Joubert
Prodevelop, Spain
Tel: +34 963 510 612
E-mail:

