by Peter Korevaar, Ulrich Schimpel and Richard Boedi
Imagine, you have to supply your customers from an inventory of several hundred thousand parts, handling tens of thousands of orders per week. Overall, you want these customers to be satisfied with at least 95% service level (number of customer requests that can be immediately satisfied.) Further, imagine your inventory comes from over one thousand suppliers with strongly varying package conditions, price structures and delivery times. At the same time you want to minimize overall costs, consisting of distribution-center inventory, handling and transportation costs. And finally, you want to manage all of this dynamically over time with a limited computational investment.

Warehouse (© Jürgen Effner - Fotolia.com)
The challenge
The above described challenge is not new and as a result many inventory and supply-chain management tools exist. In the real world, where so many variables are important, an exact solution is impossible to be calculated within reasonable computation time. For this reason, the authors developed many approximation algorithms. After several years of theoretical investigations, it was time to put these ideas to a real-life test. A German automotive manufacturer proved to be an ideal –albeit most challenging– test opportunity.
There were two main objective goals: maximizing the system-wide service level with a specified cost or minimizing the total cost for a given service level. System-wide means, that the overall service level of a group of parts is reached, though individual parts can have a different service level. The consideration of the system-wide service level makes the task difficult since changing the service level of one part including the option of not storing it changes the requirements of all other parts. Further, stability over time is required: Once the decision has been made to stock a part at the regional distribution center this decision has to be taken into account for future optimization runs.
The first application attempts made by the authors of this study showed erratic results: small changes in some of the parameters resulted in wildly different stocking policies for a large number of parts. This was resolved through a two-step approach. In the first step, extensive simulations for each of the many parts were used to obtain relations between the individual service level and the reorder point. (The reorder point specifies at which inventory level a particular part should be reordered to reach the specified service level.) For each part, the stochastic input for this simulation was the observed history. The resulting relation between service level and reorder point cannot be described by simple distributions, which prohibits using simpler approaches.

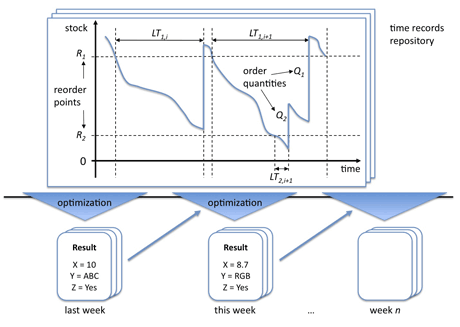
Figure 1: Inventory for one specific item.
The figure shows the inventory for a particular part as a function of time. In the first epoch, the inventory reduces until the calculated reorder point (R1) is reached. An order is then placed and after a certain amount of time (LT1,i), the ordered quantity of items arrives to replenish the stock. In the second epoch, the demand during the lead time LT1, i+1 is so large that one expects a stock-out situation before the ordered quantity arrives. In order to avoid this situation, a rush order is placed at the point R2 (rush order reorder point). Rush orders are more expensive but arrive after a short period of time. The stock is quickly restored above the minimum level, declines, and finally increases above R1 when the normal order arrives.
Many further restrictions and interactions make the solution even more complicated. This paper glosses over all these details and the interested reader is encouraged to look at the link below for a more complete description.
Please contact:
Ulrich Schimpel
IBM Zurich Research Lab, Switzerland
Link:
http://www-05.ibm.com/de/automotive/downloads/inventory-budget-optimization.pdf


