


by Maren Parnas Gulnes (University of Oslo / SINTEF AS), Ahmet Soylu (OsloMet – Oslo Metropolitan University) and Dumitru Roman (SINTEF AS)
Advances in technology have allowed the amount of neuroscience data collected during brain research to increase significantly over the past decade. Neuroscience data is currently spread across a variety of sources, typically provisioned through ad-hoc and non-standard approaches and formats, and it often has no connection to other relevant data sources. This makes it difficult for researchers to understand and use neuroscience and related data. A graph-based approach could make the data more accessible.
A graph-based approach for representing, analysing, and accessing brain-related data [1] could be used to integrate various disparate data sources and improve the understandability and usability of neuroscience data. Graph data models and associated graph database management systems provide performance, flexibility, and agility, and open up the possibility of using well-established graph analytics solutions; however, there is limited research on graph-based data representation as a mechanism for the integration, analysis, and reuse of neuroscience data.
We applied our proposed approach to a unique dataset of quantitative neuroanatomical data about the murine basal ganglia – a group of nuclei in the brain essential for processing information related to movement. The murine basal ganglia dataset consists of quantitative neuroanatomical data about basal ganglia found in healthy rats and mice, collected from more than 200 research papers and data repositories [2]. The dataset contains three distinct information types: quantitations (counts), distributions, and cell morphologies. The counts and distributions relate to either entire cells or specific parts of the cell, while the morphologies describe the cell's physical structure. The dataset's primary purpose is for researchers to find and compare neuroanatomical information about the basal ganglia brain regions.
To identify datasets that overlap with the murine basal ganglia dataset for integration purposes, we evaluated a set of related data sources, including repositories, atlases, and publicly available data, against the following criteria: (i) serves data programmatically; (ii) contains data related to the basal ganglia; and (iii) provides data that could be connected to murine basal ganglia. Figure 1 summarises the results of our investigation; Brain Architecture Management System (BAMS) [L1], InterLex [L2], and NeuroMorpho.Org [L3] matched the specified criteria.
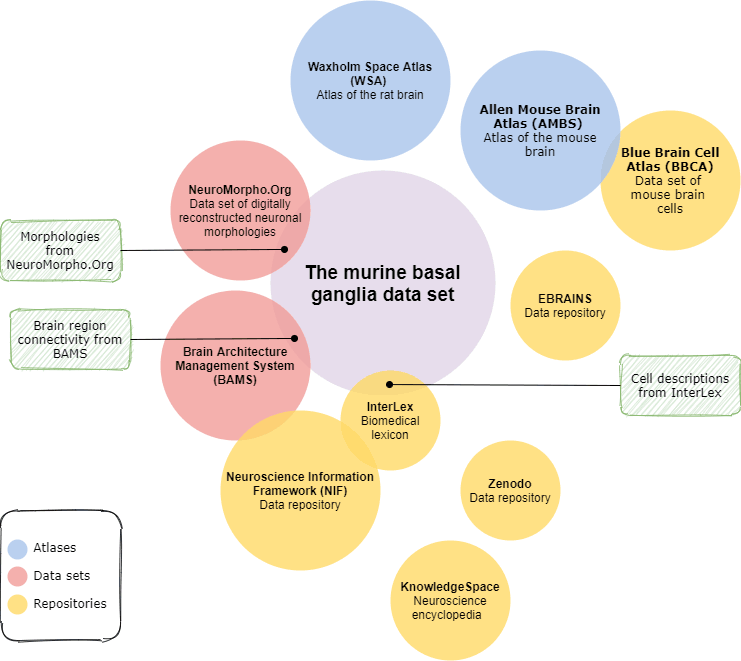
Figure 1: An overview of initiatives investigated for overlap with the murine basal ganglia dataset.
We designed and implemented a graph model for the murine basal ganglia dataset and migrated the data from the relational database into a NoSQL graph database [3]. Further, we designed and implemented the integration of data from related neuroscience data sources and the technical solution for graph-based data analysis. To provide web-based access to the graph data, we designed and implemented a web application and API. The main components of our approach were: (i) the common graph model based on a native graph database management system; (ii) integration of identified external datasets through an extract-transform-load process; (iii) graph analytics to analyse the graph data, based on existing graph algorithms and visualisation methods; (iv) web-based data access interface for the data based on the graph model. The database generated in this study consists of 9,539 distinct nodes with 46 distinct node labels, 29,807 distinct relationships, and 66 distinct relationship types [L4].
We conducted exploratory and confirmatory data analyses on the data. The former aims to obtain general information about the data and the latter to answer specific questions. For the exploratory analysis, we used community detection algorithms to investigate the graph data structure (Label propagation and Louvain algorithms), a centrality algorithm to find influential nodes in a graph (PageRank), a node similarity algorithm to compare nodes (available in Neo4j), and graph visualisations (ForcedAtlas2) to investigate the general data structure. A consultation with a neuroscience expert revealed that the results include interesting expected and unexpected findings as well as already known findings. For example, Figure 2 (a) shows that males (largest green node) are studied far more often than females. In the confirmatory data analysis part, we aimed to find similar analyses based on a specific criterion using a node similarity algorithm. For example, we searched for studies (i.e., analyses) that investigated the same cell type in the same brain region and with the same object of interest. Figure 2 (b) presents the studies (in orange) in the dataset connected to the specified nodes and species. The yellow nodes represent the two species in the dataset, and the central node in the middle is the cell type “neurons”.
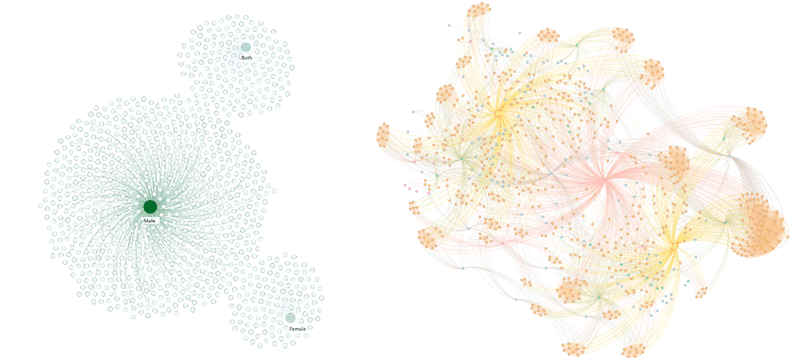
Figure 2: (a) Relationship between the dataset analyses and the sex and (b) the dataset analyses with related nodes.
The results and our experience in representing, integrating, and analysing basal ganglia data show that a graph-based approach can be an effective solution, and that the approach should be further considered for management of various types of neuroscience data.
Links:
[L1] https://bams1.org
[L2] https://scicrunch.org/scicrunch/interlex/dashboard
[L3] http://neuromorpho.org
[L4] https://github.com/marenpg/jupyter_basal_ganglia
References:
[1] R. Angles and C. Gutiérrez: “Survey of graph database models”, ACM Computing Surveys, vol. 40, no. 1, pp. 1–39, 2008.
[2] I.E. Bjerke, et al.: “Database of literature derived cellular measurements from the murine basal ganglia”, Scientific data, vol. 7, no. 1, pp. 1–14, 2020.
[3] R. Cattell: “Scalable SQL and NoSQL data stores”, Sigmod Record, vol. 39, no. 4, pp. 12–27, 2011.
Please contact:
Dumitru Roman, SINTEF AS, Norway

