


by Jakob Abeßer and Sara Kepplinger (Fraunhofer IDMT)
Noise pollution, especially in urban environments, can have negative health impacts. Smart city applications for acoustic monitoring become essential to cope with the overall increasing noise pollution in residential areas. Based on measurement data from a distributed acoustic sensor network, a web-based application allowing for a real time visualisation of the citywide noise exposure was developed as part of the research project “Stadtlärm”.
As described by Berg and Nathanson in the encyclopaedia Britannica [L1] noise pollution is unwanted or excessive sound, which may derive from industrial facilities and other workplaces, highway, railway, and airplane traffic as well as from outdoor construction activities. The type of noise source influences which noise protection regulations are used. Therefore, one of our overall goals is to measure the exposure of citizens to noise in different parts of the city based on the German technical guidelines for noise reduction (TA Lärm).
Within the research project “StadtLärm” (German for “city noise”) [L2] a distributed acoustic monitoring system [1] was developed whose sensor units are installed at the most relevant locations of both sound emission and sound immission (see Figure 1). Figure 1 gives an overview over the selected test site in the city of Jena, Germany. Acoustic sensors (orange squares) monitor the noise exposure at residential areas (purple) and nearby sound emission locations (red circles), such as open-air venues, a soccer stadium, as well as the most relevant transport routes, like streets (green) and train plus tram tracks (blue). Red arrows illustrate the most prominent sound propagation paths towards nearby residential areas. In addition to localised sound level measurements, the sensors automatically classify the most prominent sound events. This makes it possible to detect which noise sources contribute most to the noise pollution at a specific location. The system can provide valuable input data for systematic municipal planning in order to improve the residents’ quality of life in the city.
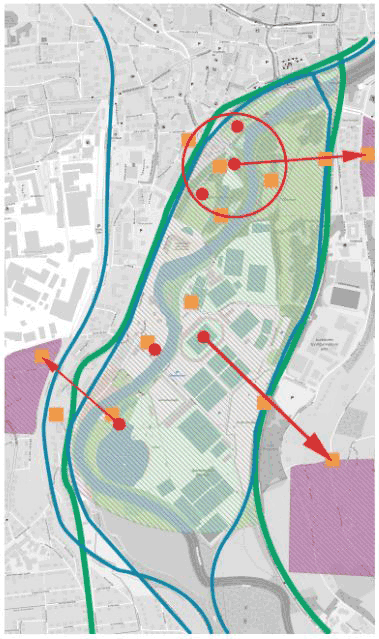
Figure 1: Targeted area in the city of Jena, Germany. Orange squares represent acoustic sensor units. Purple illustrates residential areas. Red circles show example sound emission locations. Streets are green and train and tram tracks are blue. Red arrows connect sound emission locations and nearby residential areas.
The geographic location of the target area presents two main challenges. Owing to the valley-like elevation profile in Jena, most residential areas have higher elevation than the monitored sound emission locations. Furthermore, the prevailing westerly wind direction heavily influences the sound propagation at the test site. The sensor units compute a set of standardised noise level parameters in near real-time with a temporal resolution of 125 ms. In addition, a system for acoustic scene classification based on a deep neural network estimates the probability of nine different acoustic scene classes once every second. The network uses a cascade of convolutional layers with intermediate pooling in order to recognise temporal-spectral patterns in short-term spectrograms, which are characteristic of particular sound sources [2].
Connected by a communication system based on MQTT (Message Queue Telemetry Transport) [L3], these sensors communicate measurement data to a central server for data post-processing and storage. We implement the privacy-by-design approach by transmitting only time-localised probabilities of different acoustic scene classes.
The processing component (central server) publishes measurement results, which include noise level measurements as well as acoustic scene classification results. Furthermore, it offers request/response interfaces for retrieving historical measurement data. This can be useful, for example, to correlate noise level measurements with public events that have taken place, in retrospect.
A web-based application receives and visualises live measurement data at different sensor locations on an interactive map. The map also provides additional layers of information about potential noise sources, such as road construction sites, locations of bottle banks, and playgrounds. It is possible to display the noise level values measured at the sensor units in the map application in real-time or aggregated over a configurable period. For example, the user can get a condensed overview of the past noise situation by eliminating the interferences caused by rush-hour traffic.
Finally, we will sketch several ideas for future improvements of the presented sensor network. First, displaying and communicating basic measurement results to the citizens via free and anonymous access to the application will contribute to the public acceptance of the system. In contrast, the city council can receive an extended account with further internal administrative information like conditions of the events’ approvals and local residents’ complaints. During the ongoing event, the regulatory agency of the city administration can be informed automatically via email if noise level limits are exceeded. Another approach to facilitate the administrative decision procedure is to predict future noise situations of planned events based on previously measured data.
We are extending the proposed framework for further application scenarios in an urban environment. For instance, the sensor units along the main streets allow traffic flow to be monitored and vehicle types to be identified. Furthermore, we will conduct long-term noise level analyses to identify quiet regions within the city. This information can be included in tourist recommendations, e.g., recovery area suggestions, or used for solutions addressing wellbeing and health [3].
Links:
[L1]: https://www.britannica.com/science/noise-pollution
[L2]: http://www.stadtlaerm.de/
[L3]: https://mosquitto.org/
References:
[1] J. Abeßer, et al.: “A Distributed Sensor Network for Monitoring Noise Level and Noise Sources in Urban Environments,” in: Proc. of FiCloud 2018.
[2] J. Abeßer, et al.: “Urban Noise Monitoring in the Stadtlärm Project – A Field Report”, In: Proc. of DCASE 2019.
[3] S. Kepplinger, et al.: “Perspectives about Personalization for mHealth Solutions against Noise Pollution”, in: Proc. of pHealth 2017.
Please contact:
Jakob Abeßer
Fraunhofer Institute for Digital Media Technology IDMT, Germany

