


by Gregory Stainhaouer, Stelios Bakamidis and Ioannis Dologlou (RC ATHENA)
The spectral characteristics of speech can be used to cluster individuals according to whether or not they suffer from an allergy. Based on the principles of adaptive modelling and fundamental frequency variations, as well as speech analysis by means of acoustic models, our technique achieves an efficient classification based on uttered speech over a mobile phone. The final decision is derived by combining the individual estimates, providing a tool for the automatic diagnosis of allergies.
The distinctive speech characteristics of people suffering from allergic rhinitis have the potential to enable remote diagnosis using speech analysis technology. We have developed a system for this purpose, consisting of two experts: the first provides a robust estimate of the jitter of the fundamental frequency and the second provides a confidence score derived from Hidden Markov Model-based acoustic modeling. These experts are calibrated using two sets of speech data, one from patients with allergies and a second from the same individuals after treatment. This supervised calibration allows the parameters of the two experts’ algorithms to be fine-tuned and enables some thresholds to be derived, which are subsequently used to diagnosis others.
The notion of the rank of a signal, that is needed in this work, is defined by means of the rank of its covariance matrix [1,2]. Given the signal s and the nth order covariance matrix Cn, the rank of the signal s is equal to p, where p is the rank of the covariance matrix Cn and p < n. In case p = n for all n, the signal s is said to be full rank. Full rank signals are more complex to handle and are converted to limited rank by means of a singular value decomposition (SVD) based successive projections algorithm [3].
The fundamental frequency estimation algorithm is highly accurate and consists of two steps. During the first step the goal is to obtain from the original speech signal a new one where the fundamental frequency is the predominant frequency. This signal enters the second step of the algorithm that provides an approximate rank two signal of the fundamental frequency.
The first step is based on an iterative zero-phase filtering whose frequency response is a monotonically decreasing function. This guarantees that only the energy around the fundamental frequency remains as the number of iterations increases.
For the second step the SVD algorithm to reduce the rank of a signal by successive projections is used. Finally, the jitter of the fundamental frequency is computed as the variance of the distances between consecutive peaks of the rank two signal (Figure 1).
The second expert uses acoustic models for the derivation of confidence scores for the uttered phrases. These models provide estimates of the probability of features extracted from speech and give a string of phonemes. Each phoneme is represented by a Hidden Markov Model. For the Greek language, 32 phonemes are used to describe the various pronunciations. The acoustic modelling not only provides the phonetic transcription of the utterance but also the probability of each phoneme which reflexes the confidence score.
The automatic diagnosis system was first trained and then tested using real life data collected from patients. For the training phase sixteen patients were used, who returned at a later stage when they were cured and uttered the same phrases. The two sets of experts that need to be trained are the jitter and the confidence score of the acoustic models.
In order to handle new patients, the mean values of the jitter for healthy and unhealthy subjects are computed, denoted by mjc and mjs respectively. These values are mjs=16 and mjc = 12. If jn stands for the jitter of the new patient then if jn > mjs the patient is unhealthy, whereas if jn < mjc the patient has no problem. For values of jn between mjs and mjc no accurate decision can be made (Figure 2).
The phrases are also processed by the acoustic models and a mean confidence score is produced. By denoting mps, the mean value that a patient gets before treatment, and mpc, the mean value that the same patient gets after treatment, one expects to find mpc > mps. A global mean value for all cured patients mpcg and a global mean for all unhealthy patients mpsg is computed to enable the classification of a new patient according to the confidence score criterion. These values are mpsg = 17.7 and mpcg = 18.7. If mpn stands for the mean confidence score of the new patient then if mpn < mpsg the patient is unhealthy, whereas if mpn > mpcg the patient has no allergy. For values of mpn between mpcg and mpsg no accurate decision can be made (Figure 3). A simple linear optimisation technique is used to combine the two experts in order to provide an overall decision.
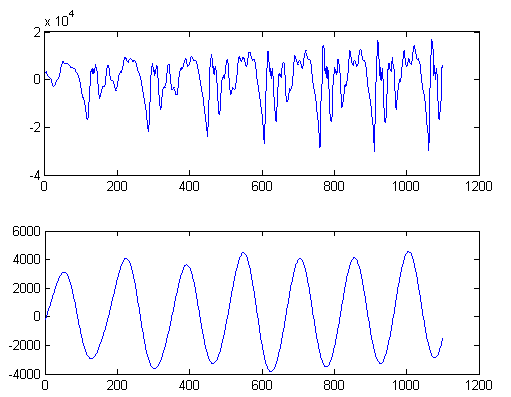
Figure 1: The top figure depicts a frame of voiced speech and the bottom figure depicts the corresponding rank two signal. Note that peaks are very clear and distances between peaks can easily be computed to ensure an accurate value for jitter.
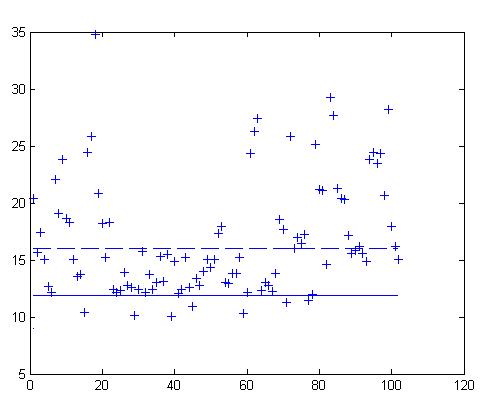
Figure 2: The solid line depicts mjc, the mean of healthy condition and the dashed line depicts mjs, the mean of allergic condition. The various + symbols depict unhealthy patients. Most of them lie beyond mjs and are safely classified. Many lie between the two means and decision becomes ambiguous and few are misclassified below mjc.
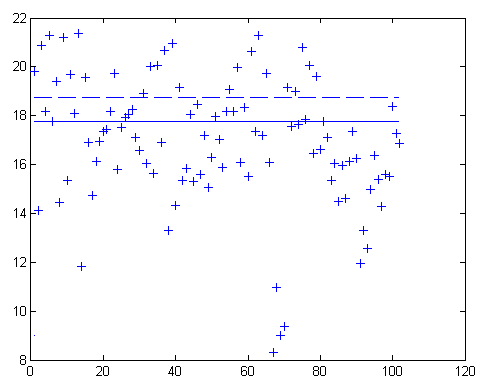
Figure 3: The dashed line depicts mpcg, the mean of healthy condition and the solid line depicts mpsg, the mean of allergic condition. The various + symbols depict unhealthy patients. Most of them lie below mpsg and are safely classified. Some lie between the two means and decision becomes ambiguous. There are also some misclassified cases lying above mpcg.
The algorithms were developed in the Research Center ATHENA in Athens Greece. The work started in October 2018 and the first version was delivered in June 2019. The project “Patient Allergy Tracer” (project code: Τ1ΕΔΚ-02436) supported this work, which is implemented under the Action “Research, Create, Innovate”, funded by the Operational Program “Competitiveness, Entrepreneurship and Innovation” (NSRF 2014-2020) and co-financed by Greece and the European Union (European Regional Development Fund).
Future activities
Future plans focus on the performance of the algorithms both in terms of accuracy and speed. Improving the accuracy involves a better training process by including more patients in the experiment and also ameliorates the performance of the acoustic models. To improve the speed, fast SVD algorithms are needed for the implementation of the successive projections algorithm.
References:
[1] I. Dologlou, G. Carayannis: “Physical interpretation of signal reconstruction from reduced rank matrices”, IEEE ASSP, July 1991, pp. 1681-1682.
[2] I. Dologlou, S. Bakamidis, G. Carayannis: “Signal decomposition in terms of non-orthogonal sinusoidal bases”, Signal Processing, Vol. 51, June 1996.
[3] J.A. Cadzow: “Signal enhancement: A composite property mapping algorithm”, IEEE, ASSP, Vol. 36, No. 1, January 1998, 49-62.
Please contact:
Ioannis Dologlou
RC ATHENA, Greece
+302106875306,

