by Paulo Carreira and Alfredo Ferreira
Information technology tools for energy management have, to date, failed to take advantage of the recent advances in human-computer interaction. In fact, considerable expertise is still required to interpret and manage energy data. Other domains, in contrast, including architecture, engineering and construction, have embraced new interaction paradigms aiming at more natural ways to interact with and analyse data. We foresee that integrating natural user interfaces with virtual and augmented reality environments in an energy management system will provide a powerful tool, enabling unskilled users to perform complex energy management activities.
Extracting meaningful information from energy data requires integrating attributes and arranging multiple elements, not only regarding consumption but also building envelope, space function, occupancy history, environmental conditions and equipment status. Traditionally, distinct tools have been used to manage these data, such as CAFM and CAMM tools, as well as energy management (EM) and building control (BCS) systems tools. Since there is no standard integration methodology and framework for energy data, as there is for business data, practitioners must interact with multiple tools to obtain relevant information [1]. Consequently, integration is improvised and largely performed mentally. In a professional setting, the amount of data is overwhelming, hampering meaningful analysis.
In addition, energy data is a type of space related information that is difficult to explore and visualize with traditional tools. Activities such as inspecting the consumption profile of specific types of space, groups of occupants, or specific equipment all have an underlying spatial dimension. Integrated rendering of spatial information is important for visualizing complex phenomena that arise when combining data from multiple sources in order to achieve new insights. Therefore, most EM tools have to manage spatial information, which can be visualized more effectively when rendered in a graphical representation.
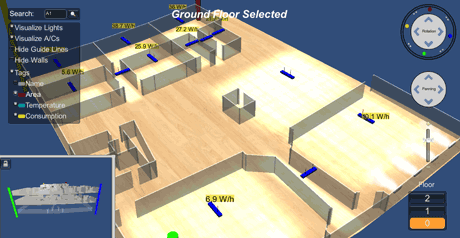
Graphical rendering accomplishes instantaneous identification of the space reality along with the relationships of the elements therein to encourage a fast response. Historically, planimetric CAD drawings and Geographical Information Systems have been used as an effective way to display and manage spatial information related to facilities.
On closely related domains, virtual and augmented reality environments are emerging as a sophisticated and effective way of rendering spatial information [2]. The domains of architecture, engineering and construction (AEC), already have tools that combine these environments with new interaction paradigms and natural user interfaces (NUIs) to improve productivity, such as the tool for HVAC maintenance presented in [3]. However, user interfaces for EM tools are not yet taking advantage of the recent advances in human-computer interaction. In fact, we believe that they are not even close to approaching the spatial dynamism and ease of use offered by virtual and augmented reality environments with NUIs.
Devising a solution of this type presents a twofold research challenge. On the one hand, integration of energy data requires the collection and analysis of large amounts of sensor and meter data. Furthermore, the database workload involves a large number of hybrid queries combining large persisted data with live data posed against an integrated schema - a problem that is not well handled by current database systems. On the other hand, we need to design adequate virtual and augmented reality environments to analyse highly-complex, multi-dimensional and space-related energy data. These challenges are highly interdependent. The more data can be integrated, the richer the interactions can be. Richer interactions, however, require answering even more data integration queries that combine persisted and live data.
Tackling these research challenges calls for a multi-disciplinary approach. At INESC-ID Lisboa, a group of specialists in data management, building automation and energy management have been collaborating with a team of human-computer interaction researchers on a novel approach to EM. We have been designing and experimenting with tools and prototypes that augment a virtual facility with energy consumption information along with spacial characteristics, location and status of equipment, while providing simple ways to control them. Unlike previous work that has largely relied on CAD or VRML for scene generation, this work takes advantage of recent game engine technologies for fast and real-time rendering of feature-rich representations of the facility, along with spacial information, equipment conditions and device status.
One of the above-mentioned tools has been rolled out commercially. Our vision is to create a platform for data integration and visualization that enables easy and efficient ways for unskilled users to explore energy data. We believe that a better, integrated ICT solution for handling energy data may translate to faster and more effective energy management through more accurate energy usage diagnostics and just-in-time corrective action that will eventually translate to a more rational usage of energy.
References:
[1] J. Granderson, M. A. Piette, G. Ghatikar, P. Price: “Building Energy Information Systems: State of the Technology and User Case Studies”, technical report, LBNL-2899E, Environmental Energy Technologies Division (2009)
[2] P. Fite-Georgel: “Is there a reality in Industrial Augmented Reality?”, in proc. of ISMAR’11, IEEE Computer Society, Washington, DC, USA, 201-210 (2011)
[3] Viet Toan Phan and Seung Yeon Choo: “Using AR for real-time crosscheck of ventilator ducts at worksite”, in proc. of VRCAI’10, ACM, New York, 293-298, 2010.
Link: http://www.inesc-id.pt
Please contact:
Paulo Carreira, Alfredo Ferreira
INESC-ID Lisboa and IST/Technical University of Lisbon, Portugal
Tel: +351 214 233 287, +351 214 233 512
E-mail:

