by Wouter Edeling (CWI) and Daan Crommelin (CWI and University of Amsterdam)
We argue that COVID19 epidemiological model simulations are subject to uncertainty, which should be made explicit when these models are used to inform government policy.
Computational models are increasingly used in decision- and policy-making at various levels of society. Well-known examples include models used to make climate projections, weather forecasting models, and more recently epidemiological models. The latter are used to model the time evolution of epidemics and the effect of interventions, e.g. social distancing or home quarantine. These models have assisted governments in their response to the COVID-19 epidemic.
When performing a physical experiment, it is common practice to provide not only the measured values themselves, but also an estimate of the uncertainty in the measurement, via error bars. This is not yet standard practice, however, when presenting predictions made by computational models. We argue that due to the increased importance of computational models for decision-making, a similar practice should be adopted. A model output without some type of uncertainty measure can lead to an incorrect interpretation of the results. This is especially relevant if there are hard thresholds that should not be exceeded. In the case of epidemiological models, for instance, such a hard threshold could be the maximum number of hospital ICU beds that are available for COVID-19 patients. A single, deterministic model prediction can give a value on the safe side of that threshold, but models nearly always have some degree of uncertainty so that there might well be a (significant) non-zero probability that the model is indeed able to cross the threshold if only the uncertainty was taken into account.
Assessing the uncertainty in computational models falls under the domain of uncertainty quantification (UQ). A common breakdown of uncertainty is that of parametric and model-form uncertainty. The latter is related to structural assumptions made in the derivation of the model form. In the case of epidemiological models one can think of missing intervention measures, e.g. a model in which contact tracing is not implemented. Parametric uncertainty deals with uncertainty in the input parameters. Models can have a large number of parameters, and in many cases their values are estimated from available data. These estimates are not perfect, and so some uncertainty remains in the inputs, which will get transferred to the predictions made by model. If the model is nonlinear, it is quite possible that the computational model actually magnifies the uncertainty from the input to the output.
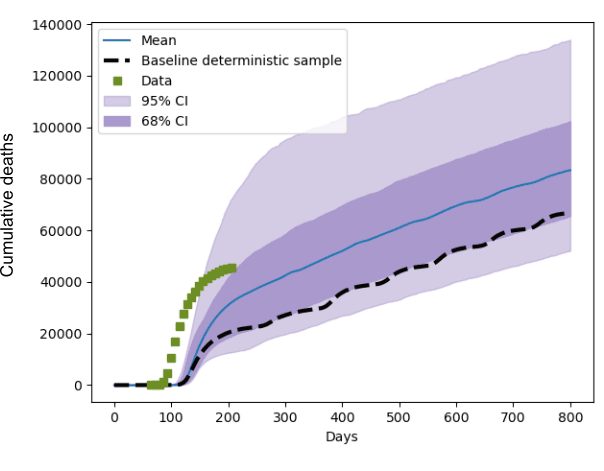
Within the EU-funded Verified Exascale Computations for Multiscale Applications project (VECMA) [L1], we are developing a UQ toolkit for expensive computational models that must be executed on supercomputers. In a recent study we used the VECMA toolkit to assess the parametric uncertainty of the CovidSim model developed at Imperial College London [1], by treating its parameters as random variables rather than deterministic inputs. CovidSim has a large number of parameters, which complicates the propagation of uncertainty from the inputs to the outputs due to the “curse of dimensionality”. This essentially means that the computational cost rises exponentially with the number of parameters that are included in the UQ study. We first identified a subset of 60 parameters that were interesting, which we further narrowed down to 19 after an iterative sensitivity study. As a 19 dimensional space is still a rather large, we used a well-known adaptive uncertainty propagation technique [3]. Such techniques bank on the existence of a lower “effective dimension”, where only a subset of all parameters has a significant impact on the output of the model. Our study [2] found that CovidSim is quite sensitive to variations in the input parameters. This work was commissioned by the Royal Society’s RAMP (Rapid Assistance for Modelling the Pandemic) team, and is a collaboration between CWI, UCL, Brunel University, University of Amsterdam and PSNC in Poland. Relative perturbations in the input parameters can be amplified to the output by roughly 300%, when the variation around the mean is measured in terms of standard deviations. Figure 1 shows the output distribution of the predicted cumulative death count, for one of the intervention scenarios we considered. It also depicts the actual death count data as recorded in the UK, and a single deterministic baseline prediction made with default parameter settings. Furthermore, in a UQ study like this, sensitivity estimates can be obtained from the results in a post-processing step. In this case we found that only 3 of the 19 considered inputs were responsible for roughly 50% of the observed output variance.

Figure 1: The distribution of the predicted cumulative death count in the UK, when the 19 input parameters were varied within 20% of their baseline values. Blue is the mean prediction, and the purple shaded areas indicate 68 and 95% confidence intervals. Day 0 is January 1st 2020 and the green squares indicate recorded UK death count data. The striped line is a deterministic prediction using default input values, which clearly shows that a single model prediction paints an incomplete picture.
Note that none of this is an argument against modelling. CovidSim provided valuable insight to the UK government at the beginning of the pandemic, e.g. about the need to layer multiple intervention strategies [1]. Instead, it is an argument for the widespread adoption of including error bars on computational results, especially in the case where models are (partly) guiding high-impact decision-making. In [L2] and [L3] it is suggested to investigate ensemble methods for this purpose, drawing on the experience from the weather and climate modelling community.
Links:
[L1] https://www.vecma.eu/
[L2] https://www.nature.com/articles/d41586-020-03208-1
[L3] https://www.sciencemuseumgroup.org.uk/blog/coronavirus-virtual-pandemics/
References:
[1] N. Ferguson,, et al. Report 9: Impact of non-pharmaceutical interventions (NPIs) to reduce COVID19 mortality and healthcare demand, 2020.
[2] W. Edeling et al. Preprint at Research Square https://doi.org/10.21203/rs.3.rs-82122/v3, 2020.
[3] T. Gerstner and M. Griebel. Dimension adaptive tensor product quadrature. Computing, 71(1):65-87, 2003.
Please contact:
Wouter Edeling, CWI, The Netherlands


