


A Bottom-up Strategy
for Clustering Complex Datasets with Application to Language and Script Discrimination
by Alessia Amelio
A bottom-up clustering algorithm can be used to extend a state-of-the-art method to partition datasets in groups of complex data. The algorithm has been applied to discriminate between documents in different languages and scripts.
Given a set of images included in a database, image clustering has the aim of grouping the images in homogeneous classes, for which images in the same class exhibit a similar informative content. Grouping depends on the image representation by descriptors capturing the informative content and on the similarity measure applied on the descriptors.
Genetic Algorithms Image Clustering (GA-IC) [1] is an evolutionary algorithm, for clustering a database of images by co-occurrence and colour centile features, representing the texture and colour image contents. A weighted graph G = <V, E, W> is retrieved from the database, where nodes V represent images of the database and edges E connect each node to the other most similar nodes. Node similarity is evaluated between the images associated with the nodes. For a given node v, the other most similar graph nodes define the h-neighbourhood of v, where h is a parameter related to the neighbourhood size. The weights W on the edges express the similarity degree among the nodes. An evolutionary strategy on the graph G finds groups of nodes representing image clusters.
Here I propose a bottom-up clustering method which is an extension of the state-of-the-art GA-IC approach. Two main modifications have been introduced, which improve performance and enable the algorithm to be used in a wider scenario of complex data. The algorithm has been applied to discriminate between documents in different languages and scripts.
The first novelty reduces the number of ‘noisy’ edges connecting the graph nodes whose corresponding objects are not particularly similar to each other. Such edges are usual in a context of complex objects for which the h-neighbourhood definition is not sufficient to capture the real similarity. Consequently, I modify the neighbourhood of a graph node v by considering only the most similar nodes which are also ‘spatially’ near to v, based on a given node ordering. In particular, I introduce a concept derived from the Matrix Bandwidth definition in the G graph construction. Let f be a node ordering, mapping the graph nodes V to integers f : V → {1, 2, ...n}, where n is the number of graph nodes. For each node v with corresponding label f(v), I compute the difference between f(v) and the labels F of the nodes in the h-neighbourhood of v. Then, I connect v with the only nodes in the h-neighbourhood whose label difference is less than or equal to a threshold value T. Figure 1 illustrates the main steps of the procedure for graph construction.
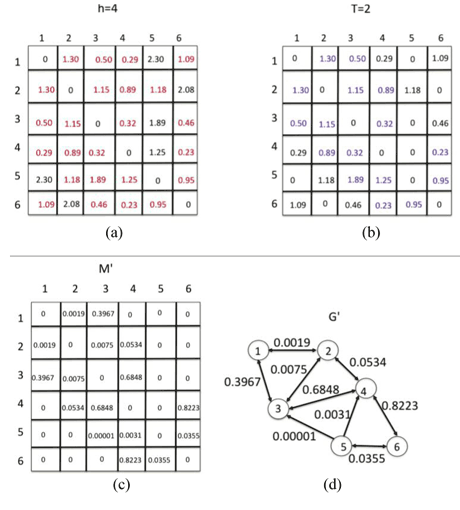
Figure 1: Example of graph construction. (a) Creation of the distance matrix, obtained by computing the distance for each pair of objects in the database (six objects). For each node (row) in the distance matrix, detection of the 4-nearest neighbors (in red). (b) For each node (row), detection of the neighbors with label difference smaller or equal to T=2 with respect to the label of that node (in blue). (c) Computation of the similarity values from the corresponding distance values. It defines the graph adjacency matrix M’. (d) Creation of the graph G′ from M′.
The second novelty introduces a bottom-up refinement strategy at the end of the GA-IC procedure, very important for improving the final solution by ‘correcting’ the local optima. Specifically, considering the clusters detected from the GA-IC evolutionary procedure, the distance for each pair of clusters is computed. The cluster pair with the minimum associated distance is then merged into a single cluster. The procedure is repeated until a fixed number of clusters is reached. The distance between two clusters is the distance between the two farthest objects, one for each cluster. Figure 2 shows the main steps of the strategy.
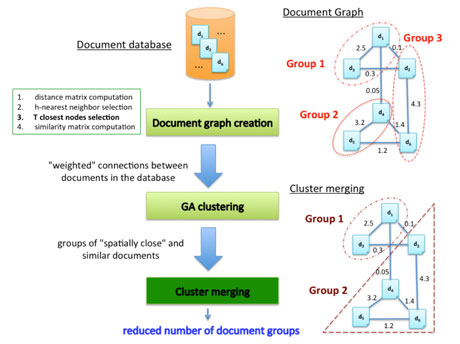
Figure 2. Diagram of the algorithm applied on a document database. Starting from the database, the first step creates the document graph (top right). It has the documents as nodes and the connections between documents as links. Weights on links represent the similarity among documents. Each node is connected to the most similar and “spatially” close other nodes. Clustering is the second step, dividing the documents in groups. Finally, a merging procedure is performed (third step) reducing the number of groups to only the most meaningful ones (bottom right). The two proposed modifications of the base approach are reported in bold (phase 3 of selection of links connecting only “spatially” near nodes) and in dark green (Cluster merging).
The bottom-up algorithm has been extensively evaluated by using well-known performance indexes on large databases of complex text documents, given in multiple languages and scripts and using different kinds of features for document image representation [2],[3], where it enlarges previous approaches by adding automatic classification.
The new strategy has been used for the discrimination of text documents in English, French, Spanish, Portuguese and Slovakian languages. Another experiment has been performed for the discrimination of documents in closely related South-Slavic languages [2], such as Serbian, Croatian, Macedonian and Slovenian. The algorithm has been also adopted for the clustering of documents written in different kinds of scripts. In particular, the approach has been tested on datasets of documents written in German scripts, such as Antiqua and Fraktur, and in South-Slavic scripts, such as Latin and Cyrillic, and Latin, Cyrillic and Glagolitic. Another much more complex experiment consisted in the differentiation of Medieval South-Slavic labels hand-engraved in stone and hand-printed in paper in the old Cyrillic, angular and round Glagolitic scripts, a real challenge for a clustering approach [3].
In these experiments, the bottom-up algorithm has been compared with a wide range of well-known classification algorithms, including the GA-IC base algorithm. In all the experiments, the new approach demonstrated its superiority with respect to the other classifiers in terms of the performance indexes, by perfectly clustering the proposed document databases.
Future work will investigate the discrimination of documents in Italian and Latin languages and will provide a useful tool for the classification of the documents in ‘old Italian’, which is important for cultural heritage preservation.
References:
[1] A. Amelio, C. Pizzuti: “A new evolutionary-based clustering framework for image databases”, Image and Sign. Proc., vol. 8509 of LNCS, pp. 322–331, Springer, 2014.
[2] D. Brodić, A. Amelio and Z. N. Milivojević: “Characterization and Distinction Between Closely Related South Slavic Languages on the Example of Serbian and Croatian”. Comp. Anal. of Images and Patterns, vol. 9256 of LNCS, Part I, pp. 654-666, Springer, 2015.
[3] D. Brodić, A. Amelio and Z. N. Milivojević: “An Approach to the Analysis of the South Slavic Medieval Labels Using Image Texture”. Rec. and Action for Scene Underst., REACTS, 2015, arXiv:1509.01978.
Please contact:
Alessia Amelio
ICAR-CNR, Italy
E-mail:

