by Ioannis Constantinou, Andreas Papadopoulos, Marios D. Dikaiakos, Nicolas Stylianides and Theodoros Kyprianou
Traditional medical practice is moving from relatively ad-hoc and subjective decision making to modern evidence-based healthcare. Evidence is based on data collected from: electronic health record (EHR) systems; genomic information; capturing devices, sensors, and mobiles; information communicated verbally by the patient; and new medical knowledge. These resources produce a collection of large and complex datasets, which are difficult to process using common database management tools or traditional data processing applications.
Currently, the data generated in the process of medical care in intensive care units (ICUs) are rarely processed in real-time, nor are they collected and used for data analysis. The existence of user-friendly platforms for accessing and analyzing such massive volumes of data could leverage an era of medical knowledge discovery and medical care quality improvement. The current absence of such platforms is due partly to the difficulty of accessing, organizing, and validating voluminous health care data produced with high time-varying arrival rates by various types of sensors, and notably to the variability of proprietary software solutions in use. The need for fast computationally-intensive scientific analysis of the data generated in ICUs thwarts the use of traditional databases and data processing applications and demands the development of cloud based solutions.
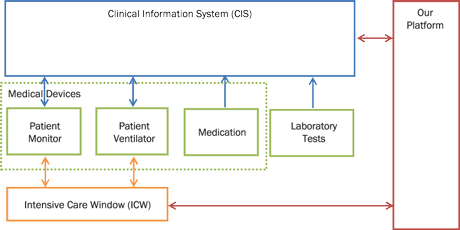
Figure 1: Platform interconnection diagram. Medical devices store data to CIS automatically. Healthcare professionals manually enter laboratory test and medication data to the system. Our platform is interconnected to CIS and ICW for automated data retrieval.
Our platform, shown in Figure 1, is able to collect data from proprietary used software solutions, such as the Clinical Information System (CIS) or via the Intensive Care Window (ICW) framework [1]. Data are produced by specialized medical equipment, or - in the case of laboratory test results and medication records - manually entered to the hospital database system by healthcare professionals. Monitors are capable of monitoring about 95 vital signs measured by devices such as patient monitors, patient ventilators, smart infusion pumps and laboratory test databases. In particular: i) The ICU patient monitor device (Philips IntelliVue MP 70) measures about 30 vital signs such as Heart Rate, EGG and SpO2. ii) The patient ventilator device (Puritan Bennett 840 ventilator) measures about 20 parameters and vital signs such us ventilator mode, minute volume and tidal volume. iii) The smart infusion pump allows the persistent storage of two values: (a) the instant flow of drugs at the time they have been validated by a caregiver (typically a nurse) and (b) the total amount of drugs administered during the last hour.
Table 1 illustrates the measurement rates of each of the vital sign type, laboratory test and medication. Vital signs are measured more frequently than medication and laboratory tests. In a small 20-bed ICU, 2.8 million records with a capacity of about 11.6 MB are stored the in platform’s data repository per day, which is equivalent to an annual data production of about 1.058 billion records with capacity of about 4.2GB.
| Description | Capture rate |
|---|---|
| Patient Monitor 31 Vital Signs (ECG, Heart Rate, SpO2, etc) | Every 30 seconds |
| Patient Ventilator 20 Vital Signs and parameters (ventilator mode, minute volume, tidal volume, etc) | Every 30 seconds |
| 27 Laboratory Tests (glucose, urea, creatinine, potassium, etc) | Thirteen of the 27 tests are captured 5 times/day. The remaining 14 are captured 24 times/day. |
| 19 Drugs (Thiopental, acetylcesteine, Furosemide, dexamethasone, etc) | Hourly |
Table 1: Capture rates for different vital signs, lab test and drug data.
Using data collected through our platform, we: (a) evaluated 12 different Glucose Variability (GV) indexes for mortality prediction; and (b) deployed a multivariate logistic regression model, enriched with patient characteristics and laboratory tests, such as age, gender, BMI, CRE, etc, in order to raise the prediction accuracy [2]. Specifically, data collected through our platform, for about 1000 patients for a period of 12 months, have been considered and analyzed using Matlab. We concluded that the majority of the GV indexes exhibit high accuracy for predicting mortality, with GVI achieving the best accuracy (72%). Furthermore, our model, based on multiple patient characteristics, achieved an 82% success rate in predicting mortality.
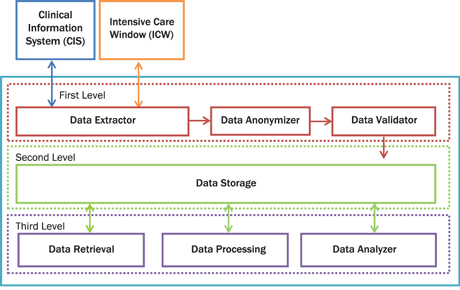
Figure 2: The future platform architecture. The platform consists of seven modules and three levels. The first level consists of Data Extractor, Data Anonymizer and Data Validator. The Data Extractor module is responsible for the interconnection between CIS and ICW. The Data Anonymizer is responsible for anonymizing critical private patient data. The Data Validator discards invalid values of vital signs, laboratory test and medication based on strictly predefined rules. At the second level is the storage module. The Data Storage module is a cloud NoSQL database. The third level is responsible for data retrieval, data processing and data analysis. The Data Retrieval module is an interface for retrieving data from the cloud. The Data Processing module is responsible for data processing and, finally, the Data Analyzer is responsible for the data analysis. The Data Analysis module will provide the powerful functionality of R statistical package.
Our goal is to integrate our current platform to a cloud-based platform for storing and analyzing ICU medical data. Our future platform would comprise three levels (Figure 2). The first level is responsible for data extraction, anonymization and validation [1]. The second level is responsible for data storage and the third level includes the tools and the interfaces for retrieval, processing and analysis of the data. We plan to extend the third level by integrating an R (a powerful open source statistical analysis software) connector for Hadoop, optimizing and expanding the various components as well as testing it on ICU patients’ vital signs for real time analysis and pattern matching.
References:
[1] N. Stylianides et al.:"Intensive Care Window: Real-Time Monitoring and Analysis in the Intensive Care Environment", IEEE Transactions on Information Technology in Biomedicine, Vol. 15, pp. 26-32, 2011.
[2] S. Kokkoris, et al.: "The ability of various glucose variability metrics for mortality prediction in critically ill patients: a comparative study", 27th Annual Congress CCIB – Barcelona, ESICM, 2013.
Please contact:
Marios D. Dikaiakos
University of Cyprus
E-mail:

