by Na Li, Martin Crane, Cathal Gurrin and Heather J. Ruskin
Even though Microsoft’s SeneseCam can be effective as a memory-aid device, there exists a substantial challenge in effectively managing the vast amount of images that are maintained by this device. Deconstructing a sizeable collection of images into meaningful events for users represents a significant task. Such events may be identified by applying Random Matrix Theory (RMT) to a cross-correlation matrix C that has been constructed using SenseCam lifelog data streams. Overall, the RMT technique proves promising for major event detection in SenseCam images.
Microsoft’s SenseCam is a lifelogging camera with a fisheye lens that is worn, suspended around the neck, to capture images and other sensor reading in an automatic record of the wearer’s every moment. SenseCam can thus collect a large amount of data, even over a short period of time, with a picture typically taken every 30 seconds, and an average of 4,000 images captured in a typical day. Even though experience shows that the SenseCam can be an effective memory-aid device, serving to improve recollection of an experience, users seldom wish to refresh their memory by browsing large image collections. Hence, tools are required to assist in the management, organization and analysis of these large data sets, eg, to automatically highlight key episodes and, ideally, to classify these in terms of importance to the life logger. Our previous research has shown that SenseCam time series exhibit a strong long-range correlation, indicating that the series do not constitute a random walk, but are cyclical, with continuous low levels of background information picked up constantly by the device [1]. Further, we have shown that a cross-correlation matrix can be analysed to highlight key episodes, thus identifying boundaries between daily events [2].
However, due to the finite length of time series available to estimate cross correlations, the matrix contains “random” contributions. As a consequence, a percentage of noise or routine event inclusion in processing is inevitable. (This phenomenon can also be observed in other domains such as the analysis of financial data and wireless communications [3]). A well-known method for addressing this type of problem is to apply Random Matrix Theory (RMT).

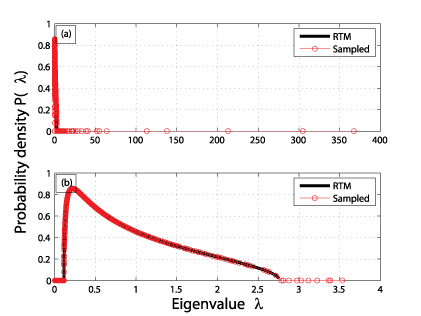
The aim is to compare the properties of the cross-correlation matrix C with those of the random correlation matrix R, separating the content of C into two groups: (a) the part reflecting properties of R (“noise”) and (b) the part that deviates from R (and contains information on major events). Figure 1 compares the probability distribution of a typical cross-correlation matrix with that for the random correlation matrix. We note the presence in the former of a well-defined “bulk” of eigenvalues, which fall within the bounds for the latter. We also note deviations for a number of the largest and smallest eigenvalues. This suggests that the cross-correlation matrix captures many major events from the data stream, but also contains substantive noise.
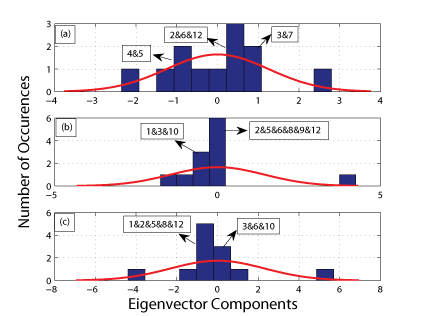
The deviations of the probability distribution of the cross-correlation matrix from RMT suggest that such deviations should also be observed in the corresponding eigenvector components. In order to interpret the meaning of the deviating eigenvectors, we note that the largest eigenvalue is an order of magnitude larger than the others. Thus, in order to analyse the contents of the remaining eigenvectors, the effect of the largest eigenvalue should first be removed. This is achieved through linear regression of the image number time series on the additive term common to all images in a similar way to that carried out by V. Plerou et al [3]. Next, we analyse the distribution of the eigenvector components of the largest, the second largest and third largest eigenvalues remaining. Figure 2 shows evidence of distinctive clustering for the distribution of eigenvector components. By examining the images, we find that each cluster involves similar light levels for a group of events. For instance in Figure 2 (a) the distribution of the eigenvector components for the largest remaining eigenvalue is related to clustering for Events 2, 6 & 12: Event 2 described the user going from outside into the office; the office is dark; switching on the lights thus caused a marked change in light levels. Broadly similar circumstances apply for Events 6 and 12; on the user walking into the building, the camera sometimes captured the lights, but at other times did not. On the user preparing to leave the office and collecting belongings, standing or stooping, the camera captured the lights from the ceiling. Several images also captured the user’s bag (dark in colour), which again gives rise to contrast in the sequence of images. A similarly clustered distribution also emerges for the other deviating eigenvalues, shown in Figure 2 (b) and (c). While variations are small compared to those found for the second largest eigenvector, this does suggest that these smaller eigenvectors may carry additional information on supporting or lead in, lead out events.

Overall, the RMT technique can serve as a fairly subtle tool for extraction of major events or key episodes and noise from the SenseCam cross-correlation matrix, with significant deviations from RMT predictions observed. Further, by examining the eigenvectors corresponding to the images, different light levels are identified to be a key source of deviation from randomness, in terms of contribution from the second largest eigenvector. In addition, similar events can be successfully and distinctively clustered. Subsequent deviating eigenvectors exhibit similar clustering and appear to presage or anticipate major events. Future work includes broadening both the user sample and the scenario range to explore the robustness of these findings.
N. Li would like to acknowledge generous support from the SCI-SYM Centre Small Scale Research Fund.
Links:
http://research.microsoft.com/en-us/um/cambridge/projects/sensecam/
http://www.computing.dcu.ie/~msc/
References:
[1] N. Li, et al.: “Automatically Detecting ‘Significant Events’ on SenseCam”, ERCIM News 2011 (87) 2011
[2] N. Li, et al.: “Multiscaled Cross-Correlation Dynamics on SenseCam Lifelogged Images”. MMM’13: Proceedings of the 19th International Conference on Multimedia Modeling, Springer Verlag, 1 2013, pp 490-501
[3] V. Plerou, et al.: “Random Matrix approach to cross correlations in financial data”, Physical Review E (65) (6), 066126+.
Please contact:
Na Li, Martin Crane, Cathal Gurrin and Heather J. Ruskin
Dublin City University, Ireland
E-mail:


