


by Christopher Humphries, Nicolas Prigent and Christophe Bidan
As networks increase in size and complexity, IT security officers are being overwhelmed by large volumes of data (alerts from IDSes, logs from various machines and services, etc). These data are often very heterogeneous and multidimensional. It is, of course, impossible to handle these data manually and even automated analysis tools are often inadequate owing to the scale of the data. This situation has reached a point at which most available data is never used. Visualization provides new hope in this context.
Visualization provides a means for representing and understanding large amounts of data in a synthetic and often aesthetic way, allowing operators to handle large amounts of data more easily. In the context of network security event monitoring, visualization provides benefits for the following activities:
- Realtime supervision, in which visualization tools emphasize and prioritize malicious events that have been detected. They also provide “situational awareness”, ie general information on what is happening in the system. In this case, visualization rarely provides detail but instead offers a global view of the system.
- Forensic analysis, in which visualization tools allow operators to mine various data sources for details about what happened in the system. Visual data mining tools are often used on a subset of data, this subset having been selected based on the detection of malicious and/or abnormal activities.
- Fast reaction, in which visualization tools help the operator to quickly react when faced with security events, eg by re-configuring a firewall or automatically deploying a patch on vulnerable systems. Visualization for fast reaction often provides supplementary information about the state of the network and security policies.
- Communication, in which visualization tools help operators explain situations with more clarity. The generated representations can be for internal purposes (enhanced ticketing systems for instance) or for external purpose, ie to improve communications about a situation a posteriori.
Many visualization tools can be used for network security event monitoring. Some are very generic and offer representations similar to those made available in traditional spreadsheet software (bar charts, pie charts, radar graphs, tree maps, etc). Others are very specific, taking specific data formats into account to offer more sophisticated representations, designed with very specific objectives in mind. For example, The Network Visualizer (TNV) [1] uses packet capture (pcap) files to represent network communication flows.
Consequently, operators in charge of monitoring the networks or the analysts performing forensic tasks are bound either to use very specific tools and hope that they will fit their every need, or to use very generic tools and sacrifice precision and context. To perform well, the latter solution requires that the user be skilled not only in network security but also in data analysis and visual information design. In fact, finding the right visualization for a given set of data requires choosing the best visual representation for the data context and current objectives. Although experts have at least partially addressed this issue [2], choosing the correct representation still requires a lot of time and experience for security specialists, especially when a background in visualization or statistics is lacking.
The security visualization workgroup in the CIDre team is currently working on a system that assists security specialists in handling and exploring security-related data. Our goal is to allow users to monitor and explore their data in a way that is as user-friendly as possible. Ideally, the user does not need to be a specialist in design or visualization: One of our long term objectives is to enable the system to automatically generate the adequate representations according to the current data and visual contexts, guided by the goals and intentions of the user. He or she is only aware of the data sources that are available and interacts with them in a natural way. Therefore, details about the requests that are made to the datasets have to be hidden. To this end, we are working on the automated translations of goals and intents from the user into traditional database requests, though not necessarily SQL. Our system also automatically selects the representations that are best suited to the user’s objectives. Finally, since forensic science is by its very nature an interactive process, we are working on the interactions between user and data through representation dynamics.
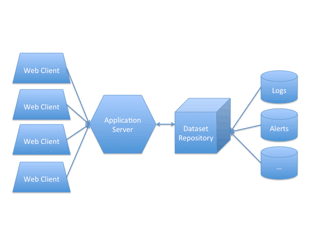
Figure 1: Architecture of the visualization system
While efficient visualization is often a user-centric problem, building a responsive and performant system is essential when dealing with large volumes of security-related data. To take this aspect into account, we are currently working on the following web-oriented architecture (see Figure 1): The dataset repository collects, stores, indexes and serves the various required datasets (snort alerts, log files, etc.). An application server accesses this dataset repository and serves the client web application and assets to multiple endpoint clients. It acts as a data server proxy and in so doing provides midpoint data caching and more powerful mathematical and statistical operations for the client. The web application itself has network components for data requests and persistent connections, and has similar caching and data processing abilities. The final layer, after the main application logic, holds our visualization components for representing and interacting with data.
By proposing new ways to interact with security-related data as well as an efficient architecture to do so, we hope to provide a more efficient, portable and flexible option for visualizing, exploring and monitoring network security events.
Link:
[1] http://tnv.sourceforge.net/
Reference:
[2] Leland Wilkinson and Graham Wills, The Grammar Of Graphics, 2nd edition, Springer, 2005
Please contact:
Nicolas Prigent
SUPELEC, France
E-mail:
