by Na Li, Martin Crane and Heather J. Ruskin
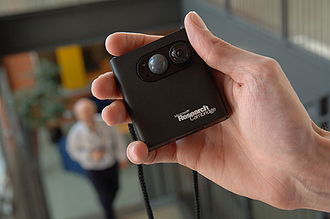
SenseCam™ is a wearable, automatic camera with support for memory recall used as a lifelogging device. Recent and continuing work in Dublin City University to apply sophisticated time series analysis methods to the multiple time series generated on a Microsoft SenseCam™ have proved useful in detecting "Significant Events".
A SenseCam™ is a small, wearable camera that takes images, automatically, in order to document the events of wearer’s day. It can be periodically reviewed to refresh and strengthen the wearer’s memory of an event. With a picture, taken typically every 30 seconds, thousands of images are captured per day. Although experience shows that the SenseCam™ can be an effective memory-aiding device, as it helps wearers to improve retention of an experience, wearers seldom wish to review life events by browsing large collections of images manually. The challenge is to manage, organise and analyse these large image collections in order to automatically highlight key episodes.
Researchers within the Centre for Scientific Computing and Complex System Modelling, (Sci-Sym) at Dublin City University have addressed this problem by applying sophisticated time series methods to analysis of the multiple time series recorded by the SenseCam™, in order to automatically capture important or significant events of the wearer’s day.

Figure 1: SenseCam.
Detrended Fluctuation Analysis (DFA) was used initially to analyse image time series, recorded by the SenseCam™ and exposed strong long-range correlation in these collections. It implies that continuous low levels of background information picked up all the time by the device. Consequently, DFA provides a useful background summary.
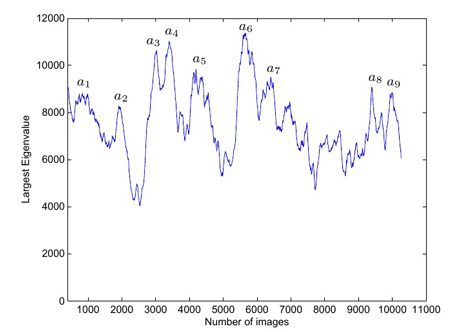
The equal-time cross-correlation matrix with different sliding window size was also used to investigate the largest eigenvalue and the changes in the sub-dominant eigenvalue ratio spectrums. The smoothness of the largest eigenvalue series was improved by choosing a larger window size, to filter small changes, with peaks evident across all scales, and large changes highlighted. We detail the scenario for the peaks in Figure 2 as an example: peaks a3 and a4 correspond to the wearer based in the office and sitting in front of the laptop. The laptop is predominantly white, with the screen the largest object in these images. The SenseCam™ captures the image basis for the two peaks, including lights on the ceiling. A small dip between the two peaks implies that the camera was blocked for a while. Clearly, images captured when objects are maintained without change are of higher quality than when movement is increased. Thus, the laptop, lights and unchanged ‘seated position’ contribute higher pixel values in these sequences of images. These consistently occurring peaks in Figure 2 aided identification of light intensity as a major event delineator during static periods of image sequence. An eigenvalue ratio analysis confirmed that the largest eigenvalue carries most of the major event information, whereas sub-eigenvalues carry information on supporting or lead in/ lead out events.

Figure 2: Largest Eigenvalue Distribution using a sliding window of 400 Images.
The dynamics of the largest eigenvalue and changes of ratios of eigenvalues were examined, using the Maximum Overlap Discrete Wavelet Transform (MODWT) method. This technique gives a clear picture of the movements in the image time series by reconstructing them using each wavelet component. Some peaks were visible across all scales, as expected, with specific event information markedly apparent at larger scales. By studying the largest eigenvalue across all wavelet scales, it was possible to identify the time series fluctuation caused by change of a single type, eg with environment constant, but with wearer movement increased or more people joining a scene. It was also possible to validate the analysis approach, by confirming that the largest time series effects are due to grouped or combined changes, eg when the wearer's environment changes completely; (involving light intensity, temperature, additional people etc.). The eigenvalue ratios analyses are in good agreement with findings for the largest eigenvalue, indicating that wavelet methods, (MODWT), provide a powerful tool for examination of the nature of the captured SenseCam™ data.
Future work includes extension of the Maximum Overlap Discrete Wavelet Transform to the investigation of changes in the cross-correlation structure across all scales. Particular features should be marked at different scales, enabling identification of key components of major or related events, and even potential classification of event type in the SenseCam™ data.
Acknowledgements
We would like to thank our colleagues from the Centre for Sensor Web Technologies, (CLARITY), at Dublin City University for research assistance.
Links:
http://research.microsoft.com/en-us/um/cambridge/projects/sensecam/
http://sci-sym.dcu.ie/
http://www.clarity-centre.org/
Please contact:
Na Li, University of Limerick and Dublin City University, Ireland
E-mail:
Martin Crane
Dublin City University, Ireland
E-mail:
Heather Ruskin
Dublin City University, Ireland
E-mail:


