by Dónall McCann, Mark Roantree, Niall Moyna and Michael Whelan
In this article we will be discussing the synchronization of sensor data in team sports. Synchronization allows us to use more expressive queries, to query across all participants in a given activity and to potentially discover new knowledge from the semantically enriched data. A collaborative research effort between groups working on data management and on health and human performance (both at Dublin City University) involved a series of experiments using wearable sensors during team games and the capture and querying of sensed data.
When dealing with sensor data for a team sport, it is often useful to be able to query across multiple sensors and thus to be able to compare data from several players for any given moment in time. In order to do this, the data from all sensors must be synchronized so that the start time of the game or activity can be identified in the data from each individual sensor.
This is necessary because sensor devices may be activated asynchronously, since the device begins recording when it first comes into contact with the player's skin. While many sensor devices will record a start time, this information is not necessarily reliable as there is often no correlation between the system time and the time kept by the match officials, or indeed between the times on any two sensors. In addition, the devices may be unreliable and may malfunction, or the device may become detached during the course of the game.
From an abstract perspective, sensors can be regarded as generating values that correspond to various states, eg first half, second half etc. A 'profile' is a combination of various states. Each state occurs once and in the order specified. The goal is to semantically enrich sensor data with an additional field that identifies the state associated with every sensor reading. Our method is to convert the sensor stream to XML, which facilitates the subsequent semantic enrichment process. In simple terms, the synchronization process involves identifying one or more specific moments in time, such as the beginning or end of the game. Once the reading corresponding to that time is identified, the data can be synchronized with the data from all the other devices involved in the experiment.
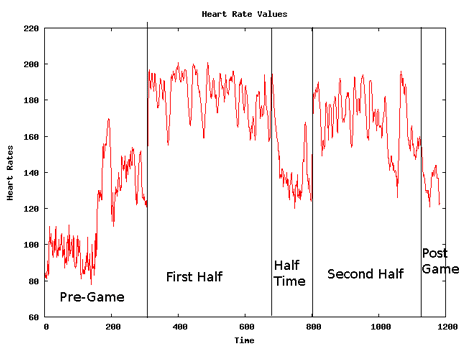
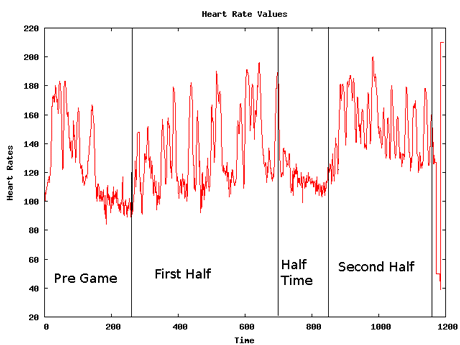
The sensors used in our experiments record a heart rate value every 5 seconds, and approximately 1200 values are generated while the device is worn. The six states corresponding to a Gaelic football match can be seen in Figure 1. This example graph is for a midfield player who has a profile of gradually increasing activity through Pre-Game and Warm-Up, and remaining constantly active throughout each half. This profile can be easily split into states because of the period of rest located between the two periods of high activity. However, this profile is atypical among the thirty players involved in a given game. A more typical graph is shown in Figure 2, corresponding to a defensive player. This graph is characterized by short bursts of activity interspersed with periods of rest, making it much more difficult to correctly identify the state boundaries. This provides a significant challenge to creating a generic process for normalizing and synchronizing sensor streams.


In order to perform our synchronization, we define a 'model' profile of the ideal shape of the data graph. This comprises two periods of consistently high activity on either side of a period of relatively low activity. This model profile is compared to the data from each sensor device until the closest match is found, in terms of intensity and duration of the activity. Identifying state boundaries for the resulting profile is reasonably simple, involving identifying the point at which the data changes in intensity and applying some rules from the domain experts to find the precise location on the curve at which the state changes. The durations of each state are then recorded based on these boundaries.
For the data from the other sensor devices, a single point is identified. In our experiments, we discovered that while in many cases it proved impossible to find precise state boundaries for all states, in every case it was possible to identify at least one, namely the beginning of the half-time period, when every player ceased intense activity and so their heart rates dropped significantly. Once this point is identified, the state durations extracted from the model profile, which should correspond to the durations of the game periods, are applied and each sensor reading is marked up with state information.
When all readings are assigned a state, it is possible to query the data according to state and across multiple sensors, resulting in richer knowledge and the potential for new knowledge discovery.
Link:
http://www.computing.dcu.ie/~isg
Please contact:
Dónall McCann, Mark Roantree,
Niall Moyna, Michael Whelan
Dublin City University, Ireland
E-mail: donall.mccann![]() computing.dcu.ie, mark.roantree
computing.dcu.ie, mark.roantree![]() computing.dcu.ie,
computing.dcu.ie,
niall.moyna![]() dcu.ie, michael.whelan
dcu.ie, michael.whelan![]() dcu.ie
dcu.ie


