by René Berndt and Alexander Sunk, Fraunhofer Austria
Value stream mapping (VSM) is a lean management methodology for analyzing and optimizing a series of events for production or services.
Even now, the first step in value stream analysis - the acquisition of the current state - is still created using pen and paper by physically visiting the production site (see Figure 1). VASCO is a tool that contributes to all parts of value stream analysis - from data acquisition on the shop floor, detailed analysis, over planning, through to simulation of possible future state maps (FSM) - always taking economic and ecological factors into consideration (see Figure 2).
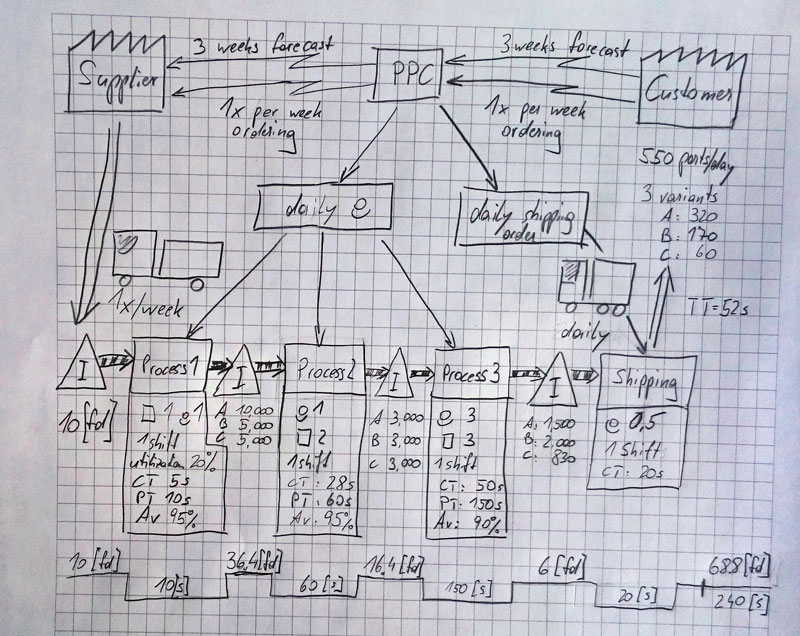
Figure 1: Typical hand-drawn VSM created at the production place.
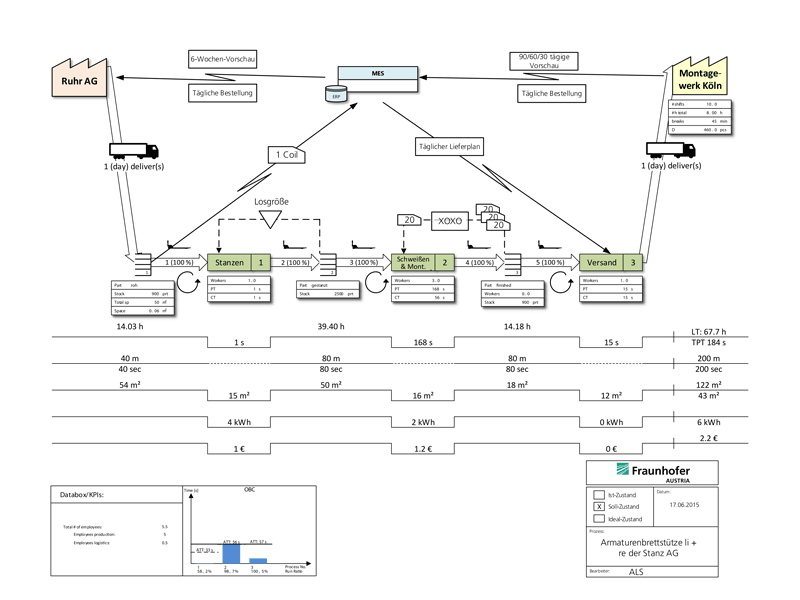
Figure 2: VSM diagram created with VASCO.
When a new product is manufactured - starting with the raw materials at the incoming goods department right through to the end product in the hands of the customer - multiple activities are required, for instance, assembly, transport and temporary storage. The aggregation of these various steps is called “value stream”. More efficient planning and implementation of the value stream means more profit for the business. Maximizing the efficiency of a value stream is becoming increasingly difficult owing to the flexible nature of modern production. Enterprises need to adopt their business to the requirements of the market - e.g. how to cope with demand fluctuations or to fulfil individual customer requests. This is one of the major challenges for value stream planning.
Based on the experience of many projects in the field of value stream optimization – and in cooperation with partners from industry - Fraunhofer Austria has been developing the software tool VASCO. This solution is tailored for flexible and sustainable value stream planning. Even the visualization and analysis of complex value streams can be performed efficiently.
VASCO is implemented as a Microsoft Visio Add-In and supports the user in creating intelligent value stream maps in a fast and user-friendly manner. Its main advantages are the automatic linking of processes and configurable logistic tasks, as well as the (optional) display of five “economic” data-lines (production time, transport distances, space area usage, energy consumption, production costs) directly underneath the value stream. Furthermore, “ecological” data-lines are implemented for assessing disposal and carbon footprint per part produced.
One of the significant features of VASCO is that all VSM related symbols are fully customizable by a configuration file. This configuration file defines which properties are added to the symbol. These properties can be classified into two major categories: manual input values or calculated values. The manual values are entered by the user, whereas the calculated values depend on a formula consisting of manually entered or other calculated values. The formula definition is also part of the configuration file and can be modified even at run-time. As a result, each company can customize VASCO to their individual needs.
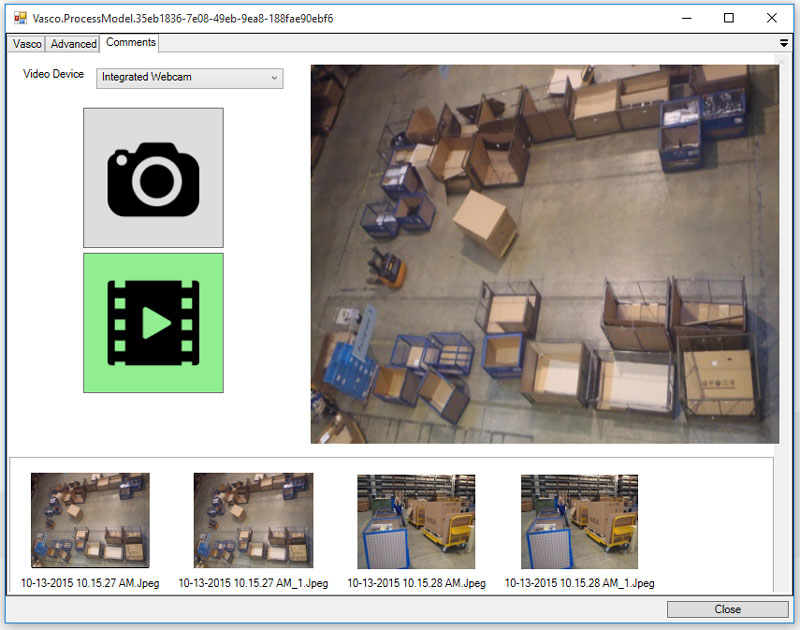
Figure 3: Annotating the VSM with images/videos/comments taken during the acquisition at the production place.
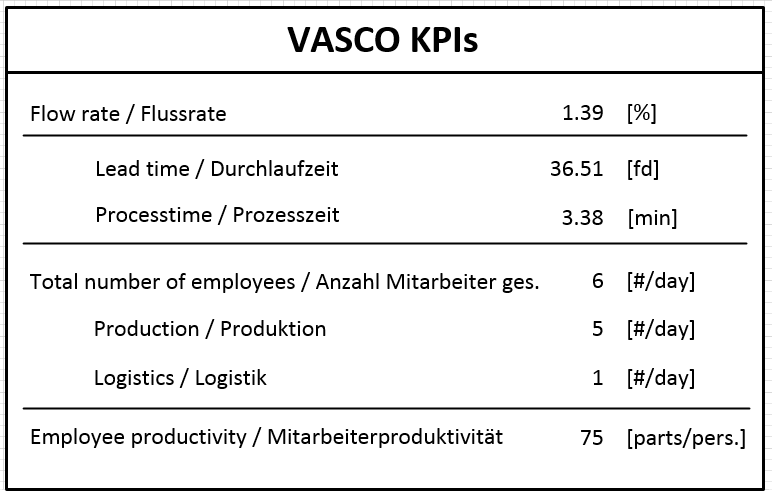
Figure 4: The Key Performance Indicator giving an overview of the operating numbers in the factory.
Another key feature of VASCO is extensibility. While VASCO is a Microsoft Visio Add-In, it can be customized by plugins itself. The basic version of VASCO is shipped with three plugins, extending the basic functionality of the tool:
- KPI-Plugin The KPI-Plugin adds additional visual features (see Figure 4) to the Visio page. This shape clearly displays the key performance indicators of the factory. Once a VASCO graph is complete and VASCO itself is in calculation mode, the values are calculated and automatically updated when a value in the graph changes.
- OBC-Plugin The operator balance chart (OBC) visualizes the total amount of work of each process compared to the takt time. The takt time can be considered as an average external rate at which customer requires goods produced. Therefore, the OBC visualizes how the cycle times of processes in the considered value stream fulfill this need. An OBC also supports optimal workload balancing between processes by making the amount of work for each operator very nearly equal to, but slightly less than, takt time. Figure 5 shows the OBC chart of the given example.
- Comment-Plugin VASCO was designed to make the acquisition and calculation of a new value stream easier and to replace the pen and paper acquisition. With the pen and paper method it is always possible to add different comments to the different symbols. In order to give the VASCO user a similar feature during the acquisition a comment plugin was created. This comment plugin enhances every symbol on a VASCO page with a comment tab (see Figure 3). When we observed that users sometimes only copied key figures from a machine into this comment tab during the data acquisition process, we further enhanced the comment-plugin with a snapshot ability. This feature enables the user to take a snapshot with the tablet instead of copying the values. It is also possible to record a video with the comment plugin. This can be used to record different views of the machine or to record the voice of the person who does the acquisition so that there is not even the
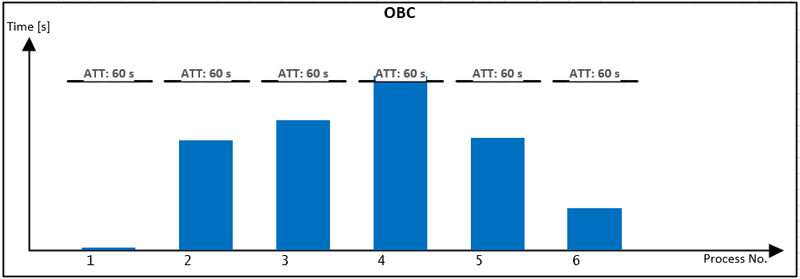
Figure 5: OBC showing the process time in relation to the takt time.
Current work-in-progress is the integration of sustainability criteria within a VSM. Ecological aspects are an increasingly important factor in addition to traditional economic considerations. “Sustainability” is the keyword that is causing enterprises to a change the way they operate. Responsible entrepreneurs and managers in Austria and throughout Europe also have responsible customers. Products with a very good environmental balance provide a competitive advantage by fulfilling the customer’s needs and the demand of efficient resource use.
Link: http://www.fraunhofer.at/vasco
Reference:
[1] R. Berndt, et al.: “Vasco - Mastering the Shoals of Value Stream Mapping”, in Proc. of the Sixth International Conference on Creative Content Technologies, 2016.
Please contact:
Thomas Edtmayr
Fraunhofer Austria

