by Daniel Gaston, Christophe Joubert and Miguel Montesinos
Modern buildings are equipped with a variety of building automation technologies and sensors which are controlled, monitored and managed through heterogeneous information systems. To date, these systems show limited interoperability and tend to operate in isolation. The future will require a more comprehensive and efficient operation of buildings facilitated by way of integrated and smart cooperative management and automation systems. Web-based open-source technologies can create 3D virtual representations of the real-time geolocated activities within a building. Such a system can simplify both the maintenance and operation by facility managers and application services to building occupants.
The European project Building as a Service – BaaS (ITEA2 – 12011, November 2013-October 2016) aims to create a reference architecture and service framework for future building automation (BA) systems with extensive integration capabilities. Based on open IT standards and open-source technologies, the BaaS framework enables easy creation of new cross-domain BA services and the largely automated integration of existing BA components in a cost effective and flexible manner. Figure 1 describes the integration of value-added visualization services on top of the reference BaaS architecture.
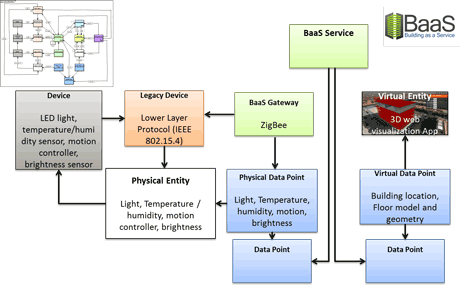
Figure 1: BaaS framework instantiated with value-added 3D visualization services.
One of the biggest challenges for building automation is the collaboration of new components and systems with existing devices and infrastructures. We contributed to this technical challenge by creating 3D building smart objects with web capabilities out of the real-time sensing BaaS platform. Such features facilitate complex user-created domain oriented applications that can be used both indoors and outdoors with a georeferenced environment and efficient XML interchange [1].
This feature has been specified as a functional requirement for the operation phase of the BaaS architecture. This requirement states that the architecture shall support the development of services that use building data models (building geometry, location and data of rooms, floors, sensors).
Based on this requirement, a set of virtual data points were defined in order to provide data to value-added services. Table 1 presents an overview of the different virtual data points that were implemented in the BaaS framework to give support for visualization web services.
| es.buildingLocation | Building location data point that provides location data of a building within a group of buildings. It provides a unique identifier, a building name, an icon URL, a tooltip text, a location (lat, lon, alt) in double precision, and a number of building floors. |
| es.floorModel | Floor model data point that provides a model data of a floor within a group of floors. It provides a unique identifier, a floor name, a building identification number, a floor level, and a geometry file identification number. |
| es.floorGeometry | Floor geometry data point that provides the geometry and additional values of a floor. It provides a unique identifier, a floor geometry file name, a floor geometry file size, geometry data, and the creation timestamp. |
Table 1: Virtual BaaS data points for value-added visualization web services.
Data points were defined based on a semantic meta-information that was specified for all phases of the BA service life-cycle in order to improve extensibility and reduce engineering effort of the BaaS platform. More specifically, the defined virtual data points used a location ontology describing the relation between building elements such Building, Floor, and Room. This ontology made use of the extended SSN ontology (for sensors and actuators) and OWL-S (for services) proposed in [2].
On top of the virtual data points, we provided a service layer implemented as REST services in order to enable real-time visualization of the building elements and sensor information through a web browser. The 3D visualization is served by an open-source WebGL Globe (Cesium) that enables the description of dynamic scenarios in virtual globes and maps. Basic architectural elements, as well as location and typology of sensors are represented in a geographical context. A specific JSON schema was described in the Cesium Language (CZML) to describe property values changing over time, such as status and information of sensors that can be provided as a stream to web clients to view dynamic values of building elements. Other values transmitted from the BaaS platform to the visualization component are the vertex positions in cartographic degrees of all floor rooms as well as the navigational model between building, floor and rooms based on the location ontology. Among the functionalities provided to the facility manager is the dynamic link between the status and information of the 3D scene with the information panel. Hence, navigation can be done either through the panel’s elements, such as the list of sensors, or through the 3D scene billboards anywhere on the building.
The results to date are very promising: we integrated the previous visualization services with many partners in order to compose various demonstration scenarios on top of the Building as a Service platform, namely Smart Booking Room, Maintenance application, and Feedback application. Trials were carried out with end-users in a real environment, the Social Building of the Valencia City Council at Patraix. The facility manager, the room booking manager, teachers and citizens booking and using the rooms for their own needs (foreign language classes, expositions, movies, presentations, yoga, etc.) were given the chance to use the 3D web user interface to visualize directly the configuration and sensing information of a room (smart booking room and maintenance application), and interact with the facility manager if the room configuration fit or not their activities and preferences (feedback application). As a result, this work enabled to increase the usability of the smart building (increase room availability by 50%) and enhance the user experience for IoT services (with a move from manual management to a digital system by Internet on building actuators). Figure 2 illustrates the 3D graphical and data visualization interface part of the facility manager’s maintenance application on the Patraix public building.
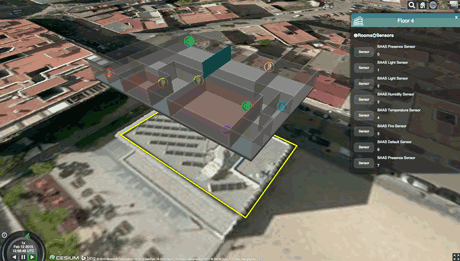
Figure 2: 3D graphical and data relation view of Patraix Building’s 4th floor.
We plan to deploy and test the results of this project in the maritime sector [3] for global situational awareness in rescue, calamity and inspection operations in port infrastructures, and in the Smart Cities platform to scale the visualization capabilities to more public buildings.
In our research, we collaborated with several SMEs, Universities and Research Centres, including: Siemens AG; Materna; Kieback&Peter; TWT; Fraunhofer; TUM; TU Dortmund; Universität Rostock (Germany); Everis; UPV (Spain); KoçSistem; BOR; Defne; Smartsoft (Turkey); X.com; Masaryk University; and MDS (Czech Republic).
This research is also part of a horizontal task force with other ICT Future Internet projects - such as FIWARE, in particular FI-CONTENT 2 - that deals with building new innovative applications and services for every-day working and living environments, by making ‘physical world information’ easily available for smart services. Our work is partially supported by the Spanish MEC INNCORPORA-PTQ 2011, MiTYC TSI-020400-2011-29, and FEDER programs.
Link:
http://www.baas-itea2.eu
References:
[1] M. Jung, J. Weidinger, W. Kastner, A. Olivieri: “Building Automation and Smart Cities: An Integration Approach Based on a Service-Oriented Architecture, pp. 1361-1367, IEEE Computer Society (2013).
[2] J. Fons, D. Gaston, C. Joubert, M. Montesinos: “Internet of Things Applications for Neighbourhood Embedded Devices”, ERCIM News 2014(98) (2014).
[3] C. Joubert, M. Montesinos, J. Sanz: “A Comprehensive Port Operations Management System”, ERCIM News 2014(97) (2014)
Please contact:
Christophe Joubert
Prodevelop, Spain
E-mail:

